 Back
BackThe Short-Run Policy Tradeoff: Inflation and Unemployment (Chapter 15 Study Notes)
Study Guide - Smart Notes
 Tailored notes based on your materials, expanded with key definitions, examples, and context.
The Short-Run Policy Tradeoff
Introduction
This chapter explores the relationship between inflation and unemployment, focusing on the short-run and long-run Phillips curves. It examines how monetary policy can influence these variables and discusses the implications for economic policy.
15.1 The Short-Run Phillips Curve
Definition and Key Features
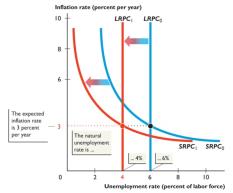
Short-run Phillips curve: A curve that shows the relationship between the inflation rate and the unemployment rate when the natural unemployment rate and the expected inflation rate remain constant.
The curve is downward sloping, indicating a tradeoff: lower unemployment is associated with higher inflation, and vice versa.
The anchor point on the curve is determined by the natural unemployment rate and the expected inflation rate.
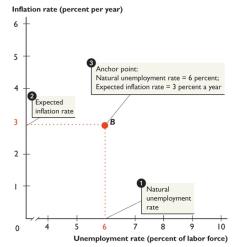
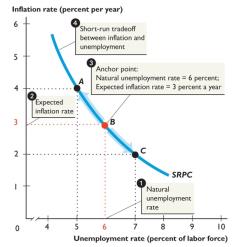
At the anchor point (e.g., 6% unemployment, 3% expected inflation), the economy is at its natural rate of unemployment.
Moving left along the curve (lower unemployment) increases inflation; moving right (higher unemployment) decreases inflation.
Connection to Aggregate Supply
The short-run Phillips curve is another way of viewing the upward-sloping aggregate supply (AS) curve.
Both arise because the money wage rate is fixed in the short run.
When the price level rises, the real wage falls, increasing labor employed and reducing unemployment.
Thus, a movement along the AS curve corresponds to a movement along the short-run Phillips curve.
Unemployment, Real GDP, and Okun’s Law
At full employment, real GDP equals potential GDP, and the unemployment rate equals the natural rate.
If real GDP exceeds potential GDP, unemployment falls below the natural rate; if real GDP is less, unemployment rises above the natural rate.
Okun’s Law: For each percentage point that the unemployment rate is above the natural rate, real GDP is about 2% below potential GDP.
Unemployment Rate (%) | Real GDP (trillions of 2005 dollars) |
|---|---|
5 | 10.2 |
6 | 10.0 |
7 | 9.8 |
Inflation and the Price Level
The inflation rate is the percentage change in the price level.
Higher inflation rates correspond to higher current price levels.
Aggregate Demand Fluctuations
Fluctuations in aggregate demand cause movements along the AS curve and the short-run Phillips curve.
Policy Relevance of the Phillips Curve
The Phillips curve focuses on two key policy targets: inflation and unemployment.
The short-run Phillips curve shifts only if the natural unemployment rate or expected inflation rate changes.
15.2 Short-Run and Long-Run Phillips Curves
The Long-Run Phillips Curve
The long-run Phillips curve is a vertical line at the natural unemployment rate.
In the long run, there is no tradeoff between inflation and unemployment; the unemployment rate returns to its natural rate regardless of inflation.
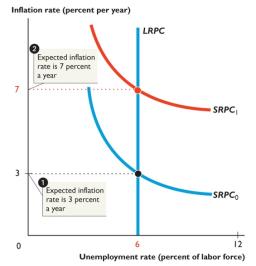
Expected Inflation and the Phillips Curve
The expected inflation rate is the rate people use to set wages and prices.
When actual inflation equals expected inflation, the economy is at full employment on the long-run Phillips curve.
The Natural Rate Hypothesis
The natural rate hypothesis states that changes in inflation affect unemployment only temporarily; in the long run, unemployment returns to the natural rate.
Shifts in the Natural Unemployment Rate
If the natural unemployment rate changes, both the short-run and long-run Phillips curves shift.
An increase shifts both curves rightward; a decrease shifts them leftward.
Historical Changes
The U.S. natural unemployment rate increased from about 5% in 1950 to over 6% in the mid-1970s, then decreased to 4.8% by 2000.
15.3 Influencing Inflation and Unemployment
Expected Inflation and Rational Expectations
The expected inflation rate is crucial for wage and price setting.
Rational expectation: Forecasts based on all available data and economic theory.
Monetary Policy and the Unemployment Rate
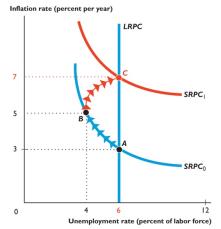
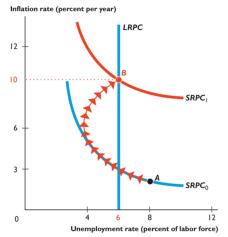
The Federal Reserve (Fed) can attempt to lower unemployment by increasing aggregate demand (raising money supply, lowering interest rates).
Initially, this reduces unemployment and raises inflation, but if unemployment is pushed below the natural rate, inflation continues to rise.
As higher inflation becomes expected, both inflation and unemployment rise, and the economy returns to the natural rate of unemployment.
Reducing Inflation: Surprise vs. Credible Policy
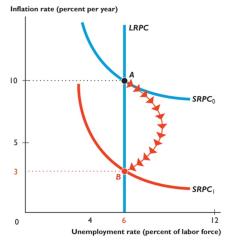
Surprise inflation reduction: The Fed unexpectedly lowers inflation, causing unemployment to rise temporarily above the natural rate.
As expectations adjust, the short-run Phillips curve shifts downward, and unemployment returns to the natural rate.
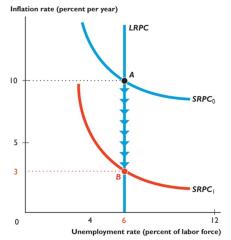
Credible announced inflation reduction: If the Fed credibly announces a plan to reduce inflation, expectations adjust immediately, shifting the short-run Phillips curve downward without increasing unemployment.
Historical example: In 1981, the Fed's unexpected inflation reduction led to high unemployment because wage contracts had been set for higher inflation.
Eye on the Tradeoff: Can We Have Low Unemployment and Low Inflation?
Short-Run vs. Long-Run Tradeoff
In the short run, a tradeoff exists: low unemployment requires higher inflation, and low inflation requires higher unemployment.
In the long run, the tradeoff can be improved only by lowering the natural unemployment rate or the expected inflation rate.
Recent U.S. Experience
From 2000–2007: Natural unemployment rate was 5%, expected inflation 3%.
From 2008–2014: Natural unemployment rate rose to 6%, expected inflation to 3.5%.
From 2015–2018: Natural unemployment rate fell to 4%, expected inflation to 2.5%.
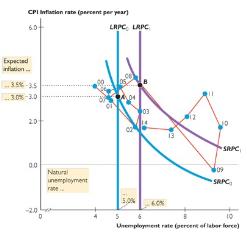


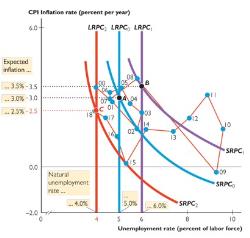
As the natural unemployment rate and expected inflation rate change, the position and shape of the Phillips curve change, altering the tradeoff between inflation and unemployment.
Key Terms and Formulas
Short-run Phillips curve (SRPC): Shows the inverse relationship between inflation and unemployment for a given expected inflation rate and natural unemployment rate.
Long-run Phillips curve (LRPC): Vertical at the natural unemployment rate; no long-run tradeoff between inflation and unemployment.
Okun’s Law:
Inflation rate:
Summary Table: Phillips Curve Relationships
Curve | Shape | Key Variable(s) | Policy Implication |
|---|---|---|---|
Short-run Phillips curve (SRPC) | Downward sloping | Expected inflation, natural unemployment rate | Short-run tradeoff between inflation and unemployment |
Long-run Phillips curve (LRPC) | Vertical | Natural unemployment rate | No long-run tradeoff; unemployment returns to natural rate |
Additional info: The Phillips curve framework is central to understanding the limitations and possibilities of monetary policy in managing inflation and unemployment. The credibility of central bank policy and the adaptability of expectations play crucial roles in determining the effectiveness of policy interventions.
