 Back
BackUnderstanding the Saving Function and Its Implications in Macroeconomics
Study Guide - Smart Notes
 Tailored notes based on your materials, expanded with key definitions, examples, and context.
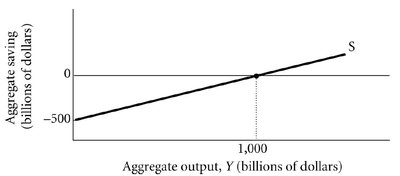
Q15. Refer to the figure above. What is the equation for the saving function?
Background
Topic: Saving Function in Macroeconomics
This question tests your ability to interpret a graph of aggregate saving as a function of aggregate output (income), and to derive the mathematical equation that represents this relationship.
Key Terms and Formulas
Saving Function: An equation that shows how aggregate saving () changes with aggregate output ().
Intercept: The value of saving when output is zero (where the line crosses the vertical axis).
Slope: The marginal propensity to save (MPS), which is the change in saving for each additional dollar of income.
Step-by-Step Guidance
Examine the graph to identify the intercept. The saving function crosses the vertical axis at billion, so the intercept is .
Identify the point where saving is zero. This occurs at billion. This means at this income level, all income is consumed and saving is zero.
Calculate the slope (MPS) using two points: and . The slope is .
Write the general form of the saving function: .
Try solving on your own before revealing the answer!
Final Answer:
, so the saving function is .
This equation matches the graph: at , ; at , .
