 Back
BackUnemployment and Inflation: Measurement, Types, and Economic Impacts
Study Guide - Smart Notes
 Tailored notes based on your materials, expanded with key definitions, examples, and context.
Unemployment and Inflation
Introduction
This chapter explores two central macroeconomic indicators: unemployment and inflation. Understanding how these are measured, their types, and their effects on the economy is essential for analyzing economic performance and policy.
Measuring Unemployment
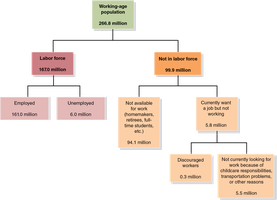
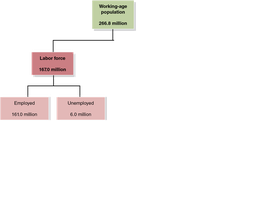
Key Labor Market Indicators
Economists use several indicators to assess the labor market:
Unemployment Rate: The percentage of the labor force that is unemployed.
Labor Force Participation Rate: The percentage of the working-age population in the labor force.
Employment–Population Ratio: The percentage of the working-age population that is employed.
These statistics are estimated monthly by the U.S. Department of Labor using surveys.
The Household Survey (Current Population Survey)
The U.S. Census Bureau conducts the Current Population Survey to classify individuals as:
Employed: Currently has a job or is temporarily away from a job.
Unemployed: Not at work but available and actively seeking work in the past month.
Not in the Labor Force: Neither employed nor unemployed (e.g., retirees, students).

Discouraged Workers
Discouraged workers are individuals available for work but not actively seeking employment because they believe no jobs are available for them. They are not counted as unemployed in official statistics.
Calculating Key Rates
Unemployment Rate:
Labor Force Participation Rate:
Employment–Population Ratio:

Limitations of the Unemployment Rate
May understate unemployment: Excludes discouraged workers and underemployed (part-time workers seeking full-time jobs).
May overstate unemployment: Some may falsely claim to be seeking work.
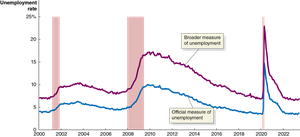
Broader Measures of Unemployment
The BLS also reports broader measures (e.g., U-6), which include discouraged and underemployed workers.
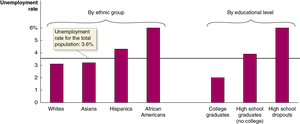
Unemployment Rate Variations
Unemployment rates differ by demographic group and education level, reflecting structural factors in the labor market.
Trends in Labor Force Participation
Labor force participation has declined for men and increased for women over time, though recently the rate for women has also declined.

The Establishment Survey
The Establishment Survey (payroll survey) samples businesses to estimate employment. It excludes self-employed and new firms but is based on actual payroll data.
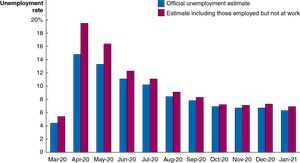
Labor Market Data Challenges
Events like the Covid-19 pandemic complicate labor market measurement, as classification of workers and seasonal adjustments become more difficult.

Job Creation and Destruction
Millions of jobs are created and destroyed each year, reflecting the dynamic nature of the U.S. labor market.
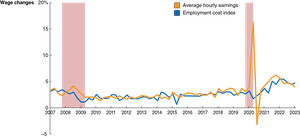
Measuring Wage Changes
The BLS tracks average hourly earnings and the employment cost index (ECI), which includes wages and benefits and adjusts for occupational mix.
Types of Unemployment
Three Main Types
Frictional Unemployment: Short-term, due to job search and transitions.
Structural Unemployment: Mismatch between worker skills and job requirements; often requires retraining.
Cyclical Unemployment: Caused by economic downturns (recessions).
Frictional Unemployment
Includes seasonal unemployment (e.g., ski instructors, farm workers).
Can increase economic efficiency by improving job matches.
Structural Unemployment
Longer-term, due to changes in industry or technology.
Example: Shift from 2-D to 3-D animation in film/TV.
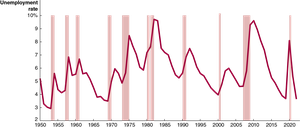
Cyclical Unemployment and the Natural Rate
Occurs during recessions; falls during recoveries.
Natural Rate of Unemployment: Unemployment due to frictional and structural factors (typically 4–5% in the U.S.).
Technological Change and Structural Unemployment
Advances in AI and automation may increase structural unemployment, as some workers find it harder to transition to new jobs.

Explaining Unemployment
Government Policies
Programs like Trade Adjustment Assistance can reduce structural unemployment by retraining workers.
Subsidies for new hires can reduce frictional unemployment.
Unemployment insurance and minimum wage laws may increase unemployment by reducing incentives to accept lower-paying jobs or by raising labor costs.
Unemployment Insurance
Provides income support to the unemployed, allowing more time for job search.
More generous in Western Europe than in the U.S.
Minimum Wage Laws
Set a wage floor; may reduce employment among low-skilled workers, especially teenagers.
Overall effect on unemployment is small at current U.S. levels.
Labor Unions
Bargain for higher wages and better conditions.
Limited impact on overall unemployment in the U.S. due to low unionization rates.
Efficiency Wages
Firms may pay above-market wages to boost productivity, which can increase unemployment if more people want these jobs than are available.
Measuring Inflation
Price Level and Inflation Rate
Price Level: Average prices of goods and services in the economy.
Inflation Rate: Percentage increase in the price level from one year to the next.
Common measures include the GDP deflator, Consumer Price Index (CPI), and Producer Price Index (PPI).
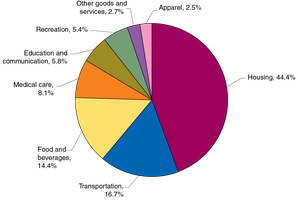
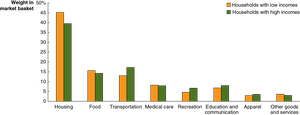
Consumer Price Index (CPI)
The CPI measures the average price of a basket of goods and services purchased by a typical urban family of four. The basket is based on a survey of 14,000 households.
Calculating the CPI
Choose a basket of goods and a base year.
Calculate the cost of the basket in the current year and the base year.
Formula:
The inflation rate is the percentage change in the CPI from one year to the next.
Limitations of the CPI
Substitution Bias: Consumers may switch to cheaper goods.
Quality Change Bias: Hard to separate price increases from quality improvements.
New Product Bias: Delay in including new goods.
Outlet Bias: Changes in where people shop (e.g., discount stores, online).
Economists estimate the CPI overstates inflation by 0.5 to 1 percentage point.
Producer Price Index (PPI)
The PPI measures average prices received by producers at all stages of production. It includes raw materials and intermediate goods and can signal future consumer price changes.
Using Price Indexes to Adjust for Inflation
Adjusting for Inflation
Price indexes like the CPI allow us to compare the purchasing power of money across years. For example, a salary of $30,000 in 1997 is equivalent to about $54,596 in 2022 dollars, adjusted for inflation.
Nominal vs. Real Variables
Nominal Variables: Measured in current-year dollars.
Real Variables: Adjusted for inflation using a price index.
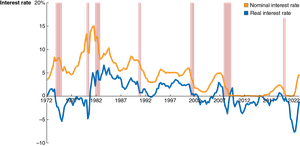
Nominal Interest Rates versus Real Interest Rates
Definitions and Calculation
Nominal Interest Rate: The stated rate on a loan.
Real Interest Rate: Adjusted for inflation; calculated as:
This distinction is important for understanding the true cost of borrowing and lending.
Does Inflation Impose Costs on the Economy?
Problems with Inflation
Not all prices and wages rise at the same rate, causing changes in real income.
People on fixed incomes are especially vulnerable to inflation.
Anticipated vs. Unanticipated Inflation
Anticipated Inflation: Still causes costs (e.g., menu costs, increased cash management, tax distortions).
Unanticipated Inflation: Creates uncertainty, making borrowing and lending riskier and potentially redistributing income unexpectedly.
Distributional Effects of Inflation
Inflation can affect different income groups differently, depending on their spending patterns and wage growth.
Summary Table: Key Labor Market and Inflation Concepts
Concept | Definition | Formula |
|---|---|---|
Unemployment Rate | Percent of labor force unemployed | |
Labor Force Participation Rate | Percent of working-age population in labor force | |
Employment–Population Ratio | Percent of working-age population employed | |
CPI | Consumer price index | |
Inflation Rate | Percent change in price level | |
Real Interest Rate | Nominal rate adjusted for inflation |
Additional info: This guide expands on the textbook outline by providing definitions, formulas, and examples for each concept, as well as highlighting the limitations and policy implications of labor market and inflation statistics.
