 Back
Backchapter 9
Study Guide - Smart Notes
 Tailored notes based on your materials, expanded with key definitions, examples, and context.
Unemployment and Inflation
Introduction
Understanding unemployment and inflation is essential for analyzing the health and performance of an economy. This chapter explores how these key macroeconomic indicators are measured, the different types of unemployment, the causes and consequences of inflation, and the implications for economic policy and society.
Measuring Unemployment
Key Labor Market Indicators
Economists use several indicators to assess the labor market:
Unemployment Rate: The percentage of the labor force that is unemployed.
Labor Force Participation Rate: The percentage of the working-age population in the labor force.
Employment-Population Ratio: The percentage of the working-age population that is employed.
These statistics are estimated monthly by the U.S. Department of Labor using surveys.
The Household Survey (Current Population Survey)
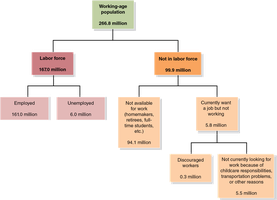
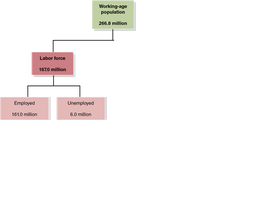
The U.S. Census Bureau conducts the Current Population Survey to classify individuals as:
Employed: Currently has a job or is temporarily away from a job.
Unemployed: Not currently at work but available and actively seeking work in the past month.
Not in the Labor Force: Neither employed nor unemployed (e.g., retirees, students).
Discouraged Workers: Available for work but not actively seeking because they believe no jobs are available.


Calculating Key Rates
Unemployment Rate:
Labor Force Participation Rate:
Employment-Population Ratio:
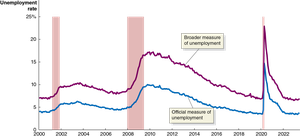
Limitations of the Unemployment Rate
May understate unemployment (e.g., discouraged workers, underemployed workers).
May overstate unemployment (e.g., false claims of job search, informal work).
Broader measures, such as BLS series U-6, include discouraged and underemployed workers.
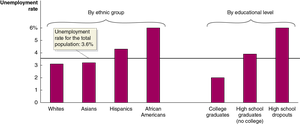
Unemployment Rate Variations
Unemployment rates differ by demographic group and education level, reflecting structural factors in the labor market.
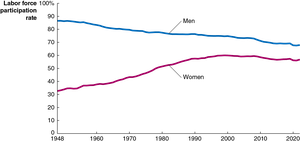
Labor Force Participation Trends
Participation rates have declined for men and increased for women since 1948, though recent trends show a decline for women as well.
The Establishment Survey (Payroll Survey)
This survey samples businesses to estimate employment. It excludes self-employed individuals and new firms, but is based on actual payroll data, reducing self-reporting bias.
Job Creation and Destruction
The labor market is dynamic, with millions of jobs created and destroyed each year. Net changes in employment do not capture this underlying churn.
Types of Unemployment
Three Main Types
Frictional Unemployment: Short-term, due to job search and transitions (e.g., new entrants, seasonal work).
Structural Unemployment: Persistent mismatch between workers' skills and job requirements (e.g., technological change).
Cyclical Unemployment: Caused by economic downturns (recessions).
Natural Rate of Unemployment
The natural rate of unemployment is the sum of frictional and structural unemployment, typically estimated at 4–5% in the U.S. It represents 'full employment'—the lowest sustainable unemployment rate without accelerating inflation.
Explaining Unemployment
Government Policies
Trade Adjustment Assistance: Training for workers displaced by foreign competition (reduces structural unemployment).
Unemployment Insurance: Provides income support, allowing longer job search but may increase unemployment duration.
Minimum Wage Laws: Set wage floors; modest effects on overall unemployment but can reduce employment among low-skilled workers.
Labor Unions: Bargain for higher wages; limited effect on overall unemployment in the U.S. due to low unionization rates.
Efficiency Wages: Firms pay above-market wages to boost productivity, which can increase unemployment if more people seek these jobs than are available.
Measuring Inflation
Price Level and Inflation Rate
Price Level: Average of current prices for goods and services in the economy.
Inflation Rate: Percentage increase in the price level from one year to the next.
Common measures include the GDP deflator, Consumer Price Index (CPI), and Producer Price Index (PPI).
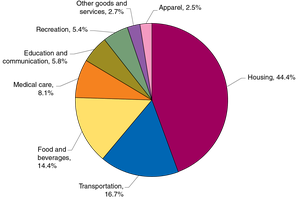
Consumer Price Index (CPI)
The CPI measures the average price of a fixed basket of goods and services purchased by a typical urban family. It is used to track changes in the cost of living.
Calculating the CPI
Choose a basket of goods and services.
Find the cost of the basket in the base year and the current year.
Calculate CPI:
The inflation rate is then:
Limitations of the CPI
Substitution Bias: Consumers may switch to cheaper alternatives.
Quality Change Bias: Hard to separate price increases from quality improvements.
New Product Bias: Delay in including new goods.
Outlet Bias: Changes in where people shop (e.g., discount stores, online).
Economists estimate the CPI overstates inflation by 0.5 to 1 percentage point.
Producer Price Index (PPI)
The PPI measures average prices received by producers at all stages of production. It can signal future changes in consumer prices.
Using Price Indexes to Adjust for Inflation
Adjusting for Inflation
To compare monetary values across time, use the CPI to convert past values into current dollars:
Nominal variables are measured in current dollars; real variables are adjusted for inflation.
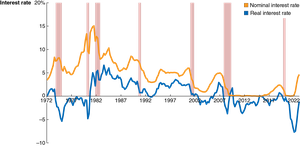
Nominal Interest Rates vs. Real Interest Rates
Definitions and Calculation
Nominal Interest Rate: The stated rate on a loan.
Real Interest Rate: Adjusted for inflation;
The real interest rate more accurately reflects the true cost of borrowing and the real return to lenders.
Does Inflation Impose Costs on the Economy?
Problems with Anticipated Inflation
Redistribution of income due to fixed prices or wages.
Increased costs of holding cash (money loses value).
Menu costs: Expenses associated with changing prices.
Taxation on nominal, not real, returns.
Problems with Unanticipated Inflation
Uncertainty makes borrowing and lending risky.
Unexpected inflation can benefit borrowers and hurt lenders, or vice versa.
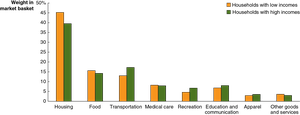
Distributional Effects of Inflation
Inflation can affect different income groups differently, depending on their spending patterns and wage growth. For example, high inflation in car prices may impact higher-income households more, while wage growth for lower-income workers may outpace inflation in some periods.
Additional info: The chapter also discusses the impact of government policies, labor market dynamics during the Covid-19 pandemic, and the importance of using both household and establishment surveys for a comprehensive view of employment.
