 Back
BackUnemployment: Concepts, Measurement, and Labour Market Dynamics
Study Guide - Smart Notes
 Tailored notes based on your materials, expanded with key definitions, examples, and context.
Unemployment
Introduction to Unemployment
Unemployment is a central topic in macroeconomics, reflecting the health and dynamics of the labour market. It is influenced by various factors, including economic cycles, structural changes, and the process of matching workers to jobs.
Classical Model Drawback: The classical model of macroeconomics implies zero unemployment, which is unrealistic in practice.
Possible Explanations for Unemployment:
Real wages may be slow to adjust.
Matching people to jobs is time-consuming.
Acquiring the right skills can take a long time.
Labour Market Statuses
The labour market is divided into three main statuses, which help economists measure and analyze employment trends.
Employed: Individuals who worked during the past week.
Unemployed: Individuals who did not work during the past week but actively sought work in the previous four weeks.
Out of the Labour Force: Individuals who did not work during the past week and did not look for work during the past four weeks.
Labour Force: The sum of employed and unemployed workers.
Key Labour Market Ratios (2023)
These ratios provide insight into the state of the labour market and are commonly used in macroeconomic analysis.
Unemployment Rate: The fraction of the labour force that is unemployed. (≃5.4%; edging up in 2024)
Participation Rate: The fraction of the labour force in the working-age population. (≃65.6%)
Employment Ratio: The fraction of the employed in the working-age population. (≃62.1%)
Labour Market Flows
The labour market is characterized by continuous movement of individuals between different employment states. This process is known as 'churning.'
About 60% of unemployed individuals remain unemployed each month.
Some become discouraged workers and stop searching for jobs.
Labour Market Flow Diagram
The diagram below illustrates the flows between employment, unemployment, and being out of the labour force, including the size of each group and the monthly transitions. 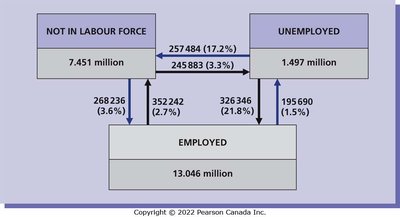
Employed: 13.046 million
Unemployed: 1.497 million
Not in Labour Force: 7.451 million
Monthly Flows:
From Not in Labour Force to Unemployed: 257,484 (17.2%)
From Unemployed to Not in Labour Force: 245,883 (3.3%)
From Not in Labour Force to Employed: 268,236 (3.6%)
From Employed to Not in Labour Force: 352,242 (2.7%)
From Unemployed to Employed: 195,690 (1.5%)
From Employed to Unemployed: 326,346 (21.8%)
Duration and Nature of Unemployment
Unemployment Spell: The length of time an individual is continuously unemployed. The spell ends when the individual finds a job.
Most unemployment spells are short (2 months or less).
Most people unemployed on a given date are long-term unemployed.
Types of Unemployment
Unemployment can be classified into three main types, each with distinct causes and implications.
Frictional Unemployment: Caused by the time it takes for workers and firms to find each other. It is usually short-term.
Structural Unemployment: Long-term and chronic, often affecting unskilled or low-skilled workers. It results from technological change and the reallocation of labour.
Cyclical Unemployment: Occurs during recessions due to low demand for goods and services.
Cyclical Unemployment and the Natural Rate
Natural Rate of Unemployment (): The rate that prevails when the economy is at full employment, caused by frictional and structural factors.
Cyclical Unemployment: The difference between the actual unemployment rate and the natural rate.
Demographic Patterns in Unemployment
Unemployment rates vary across different demographic groups.
Higher Unemployment Rates:
Males
The young
The less educated
Additional info:
Unemployment rates by gender, age, and education are important for policy analysis and targeting interventions.
