 Back
BackWhere Prices Come From: The Interaction of Demand and Supply
Study Guide - Smart Notes
 Tailored notes based on your materials, expanded with key definitions, examples, and context.
Where Prices Come From: The Interaction of Demand and Supply
Introduction
This chapter explores how prices are determined in markets through the interaction of demand and supply. It covers the factors influencing demand and supply, the concept of market equilibrium, and how shifts in demand and supply affect equilibrium price and quantity. Understanding these concepts is fundamental to macroeconomic analysis and policy-making.
The Demand Side of the Market
Demand Schedules and Demand Curves
Demand schedule: A table showing the relationship between the price of a product and the quantity demanded.
Demand curve: A graphical representation of the relationship between the price of a product and the quantity demanded.
Market demand: The total demand by all consumers for a given good or service.
The Law of Demand
Law of demand: Holding everything else constant, when the price of a product falls, the quantity demanded increases; when the price rises, the quantity demanded decreases.
This relationship is explained by:
Substitution effect: When a good becomes cheaper relative to other goods, consumers substitute toward it.
Income effect: A lower price increases consumers' purchasing power, allowing them to buy more.
Ceteris Paribus Condition
Ceteris paribus: Latin for "all else equal"; used to isolate the effect of one variable by holding others constant.
Variables That Shift Market Demand
Income:
Normal good: Demand increases as income rises.
Inferior good: Demand increases as income falls.
Prices of related goods:
Substitutes: Goods used for the same purpose; an increase in the price of one increases demand for the other.
Complements: Goods used together; an increase in the price of one decreases demand for the other.
Tastes: Changes in consumer preferences can shift demand.
Population and demographics: Changes in the size and composition of the population affect demand.
Expected future prices: If consumers expect prices to rise, current demand increases.
Natural disasters and pandemics: Can cause sudden shifts in demand for certain goods.
Change in Demand vs. Change in Quantity Demanded
Change in demand: A shift of the demand curve due to non-price factors.
Change in quantity demanded: A movement along the demand curve due to a change in the product's price.
The Supply Side of the Market
Supply Schedules and Supply Curves
Supply schedule: A table showing the relationship between the price of a product and the quantity supplied.
Supply curve: A graphical representation of the relationship between the price of a product and the quantity supplied.
The Law of Supply
Law of supply: Holding everything else constant, increases in price cause increases in quantity supplied, and decreases in price cause decreases in quantity supplied.
Variables That Shift Market Supply
Prices of inputs: Higher input prices decrease supply (shift left); lower input prices increase supply (shift right).
Technological change: Improvements increase supply; negative changes decrease supply.
Prices of related goods in production: Substitutes in production and complements in production affect supply decisions.
Number of firms: More firms increase supply; fewer firms decrease supply.
Expected future prices: If firms expect higher future prices, they may decrease current supply.
Natural disasters and pandemics: Can reduce supply by damaging production capacity.
Change in Supply vs. Change in Quantity Supplied
Change in supply: A shift of the supply curve due to non-price factors.
Change in quantity supplied: A movement along the supply curve due to a change in the product's price.
Market Equilibrium: Putting Demand and Supply Together
Market Equilibrium
Market equilibrium: The point where quantity demanded equals quantity supplied.
Competitive market equilibrium: Equilibrium in a market with many buyers and sellers.
Surpluses and Shortages
Surplus: Quantity supplied exceeds quantity demanded at the current price; leads to downward pressure on price.
Shortage: Quantity demanded exceeds quantity supplied at the current price; leads to upward pressure on price.
The Effect of Demand and Supply Shifts on Equilibrium
Shifts in Demand
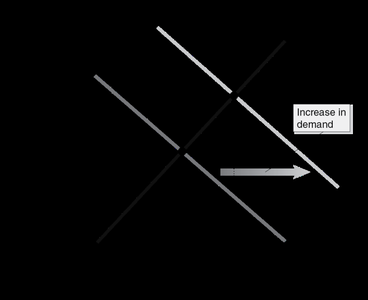
An increase in demand shifts the demand curve to the right, raising both equilibrium price and quantity.
A decrease in demand shifts the demand curve to the left, lowering both equilibrium price and quantity.
Shifts in Supply
An increase in supply shifts the supply curve to the right, lowering equilibrium price and raising equilibrium quantity.
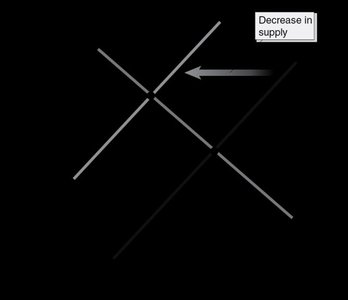
A decrease in supply shifts the supply curve to the left, raising equilibrium price and lowering equilibrium quantity.
Simultaneous Shifts in Demand and Supply
If both demand and supply increase, equilibrium quantity increases, but the effect on price depends on which shift is larger.
If both demand and supply decrease, equilibrium quantity decreases, but the effect on price depends on which shift is larger.
If demand increases and supply decreases, equilibrium price rises; the effect on quantity depends on the relative size of the shifts.
If demand decreases and supply increases, equilibrium price falls; the effect on quantity depends on the relative size of the shifts.
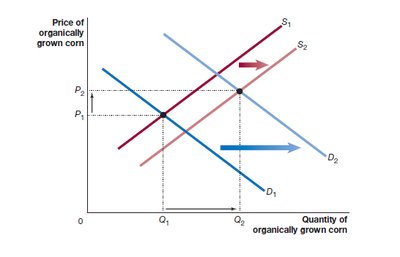
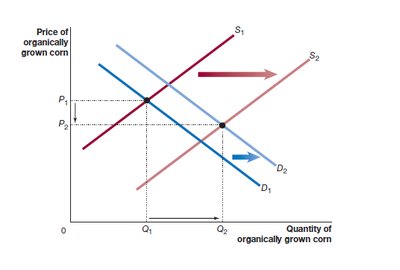
Example: Organically Grown Corn
Suppose consumer tastes shift toward organic corn (demand increases) and imports of organic corn increase (supply increases). The equilibrium quantity will definitely increase, but the effect on price is uncertain—it could rise or fall depending on which curve shifts more.
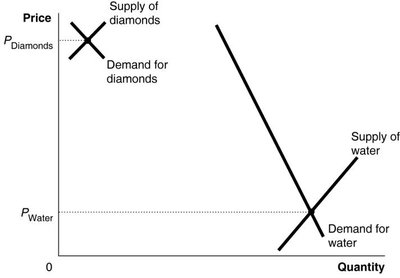
Example: Diamonds vs. Water
Diamonds are much more expensive than water, even though water is essential. This is explained by the relative scarcity and supply of each good. The supply of water is much greater than the supply of diamonds, leading to a lower equilibrium price for water.
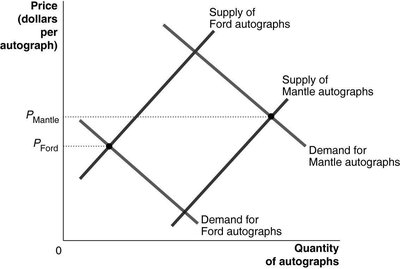
Example: Autograph Market
The price of autographs depends on both demand and supply. If the supply of Mantle autographs is much greater than Ford autographs, but the demand for Mantle autographs is also much greater, the equilibrium price for Mantle autographs can be higher.
Summary Table: Effects of Shifts in Demand and Supply
Change | Equilibrium Price | Equilibrium Quantity |
|---|---|---|
Increase in demand | Rises | Rises |
Decrease in demand | Falls | Falls |
Increase in supply | Falls | Rises |
Decrease in supply | Rises | Falls |
Increase in demand and supply | Uncertain | Rises |
Decrease in demand and supply | Uncertain | Falls |
Key Terms
Ceteris paribus: Holding all else equal.
Competitive market equilibrium: Equilibrium with many buyers and sellers.
Complements: Goods used together.
Demand curve: Graph showing price and quantity demanded.
Demand schedule: Table showing price and quantity demanded.
Demographics: Population characteristics.
Income effect: Change in quantity demanded from a price change's effect on purchasing power.
Inferior good: Demand increases as income falls.
Law of demand: Price up, quantity demanded down (and vice versa).
Law of supply: Price up, quantity supplied up (and vice versa).
Market demand: Total demand in a market.
Market equilibrium: Quantity demanded equals quantity supplied.
Normal good: Demand increases as income rises.
Perfectly competitive market: Many buyers/sellers, identical products, no entry barriers.
Quantity demanded: Amount consumers are willing and able to buy at a given price.
Quantity supplied: Amount firms are willing and able to sell at a given price.
Shortage: Quantity demanded exceeds quantity supplied.
Substitutes: Goods used for the same purpose.
Substitution effect: Change in quantity demanded from a price change relative to other goods.
Supply curve: Graph showing price and quantity supplied.
Supply schedule: Table showing price and quantity supplied.
Surplus: Quantity supplied exceeds quantity demanded.
Technological change: Changes in production efficiency.
Formulas and Equations
Market equilibrium condition:
Linear demand function:
Linear supply function:
Where is quantity demanded, is quantity supplied, is price, and are constants.
Applications and Examples
Natural disasters and price controls: Price caps after disasters can create shortages, making recovery harder by reducing incentives for suppliers to bring goods to affected areas.
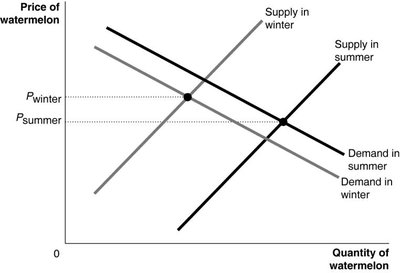
Seasonal effects: The supply and demand for goods like watermelon can shift seasonally, affecting equilibrium price and quantity.
Summary
The interaction of demand and supply determines market prices and quantities. Shifts in demand or supply curves, caused by changes in income, tastes, input prices, technology, and other factors, lead to new equilibrium outcomes. Understanding these dynamics is essential for analyzing real-world markets and policy interventions.
