 Back
BackMicrobial Metabolism: Enzymes, Pathways, and Energy Production
Study Guide - Smart Notes
 Tailored notes based on your materials, expanded with key definitions, examples, and context.
Microbial Metabolism
Overview of Metabolism
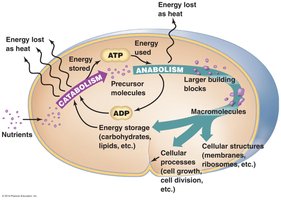
Metabolism encompasses all the chemical reactions that occur within a cell, divided into two main categories: catabolism and anabolism. Catabolism involves the breakdown of nutrients to release energy, while anabolism uses energy to build macromolecules necessary for cellular structure and function.
Catabolism: Degradative, energy-yielding reactions (e.g., breakdown of glucose).
Anabolism: Biosynthetic, energy-consuming reactions (e.g., synthesis of proteins, nucleic acids).
ATP: The main energy currency, linking catabolic and anabolic processes.
Enzymes and Their Function
Enzyme Structure and Mechanism
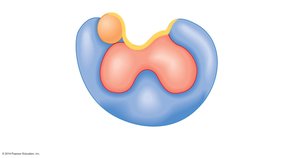
Enzymes are biological catalysts that accelerate chemical reactions by lowering the activation energy required. They are typically proteins, sometimes requiring non-protein cofactors for activity.
Apoenzyme: The protein portion of an enzyme.
Cofactor: Non-protein component required for enzyme activity (can be inorganic or organic).
Holoenzyme: The complete, active enzyme with its cofactor.
Types of Cofactors
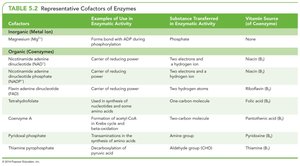
Cofactors are essential for the catalytic activity of many enzymes. They can be inorganic ions or organic molecules (coenzymes).
Cofactor | Example of Use | Substance Transferred | Vitamin Source |
|---|---|---|---|
Magnesium (inorganic) | Forms bond with ADP during phosphorylation | Phosphate | None |
Nicotinamide adenine dinucleotide (NAD+) | Carrier of reducing power | Two electrons and one hydrogen ion | Niacin (B3) |
Flavin adenine dinucleotide (FAD) | Carrier of reducing power | Two electrons and two hydrogen ions | Riboflavin (B2) |
Coenzyme A | Transfers acyl groups | Two-carbon molecule | Pantothenic acid (B5) |
Pyridoxal phosphate | Transfers amino groups | Amino group | Pyridoxine (B6) |
Thiamine pyrophosphate | Decarboxylation and aldehyde transfer | Aldehyde group (CHO) | Thiamine (B1) |
Enzyme-Substrate Interaction
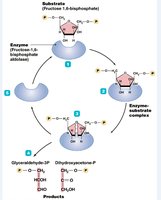
The lock and key hypothesis describes how the substrate fits precisely into the enzyme's active site, forming an enzyme-substrate complex that facilitates the reaction.
Active Site: Region on the enzyme where the substrate binds.
Enzyme-Substrate Complex: Temporary association during the reaction.
Enzyme Kinetics and Regulation
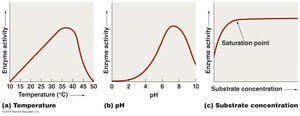
Enzyme activity is influenced by several factors, including temperature, pH, and substrate concentration. Extreme conditions can lead to denaturation, rendering the enzyme inactive.
Temperature: Each enzyme has an optimal temperature for activity.
pH: Each enzyme has an optimal pH range.
Substrate Concentration: Activity increases with substrate concentration until saturation is reached.
Enzyme Inhibition
Enzyme activity can be regulated by inhibitors, which are molecules that decrease or halt enzyme function. There are two main types:
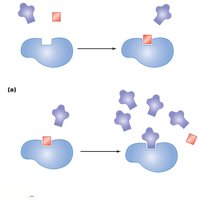
Competitive Inhibitors: Compete with the substrate for the active site; can be overcome by increasing substrate concentration.
Noncompetitive Inhibitors: Bind to an allosteric site, changing the enzyme's shape and function; cannot be overcome by substrate increase.
Feedback Inhibition: End-product of a pathway inhibits an earlier step, regulating pathway activity.
 l
l
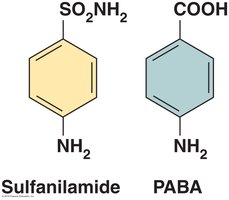
Example: Sulfanilamide as a Competitive Inhibitor
Sulfanilamide, a sulfa drug, acts as a competitive inhibitor by mimicking para-aminobenzoic acid (PABA), a substrate in bacterial folic acid synthesis.
Redox Reactions and Electron Carriers
Redox Reactions
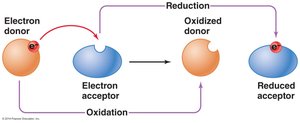
Redox (reduction-oxidation) reactions are essential for energy transfer in cells. One molecule loses electrons (oxidation), while another gains them (reduction).
Oxidation: Loss of electrons.
Reduction: Gain of electrons.
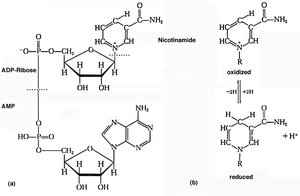
Electron Carriers
Electron carriers such as NAD+ and FAD collect electrons during catabolic reactions and deliver them to the electron transport chain (ETC).
NAD+ (Nicotinamide Adenine Dinucleotide): Accepts two electrons and one proton to become NADH.
FAD (Flavin Adenine Dinucleotide): Accepts two electrons and two protons to become FADH2.
ATP Synthesis and Phosphorylation
ATP Production
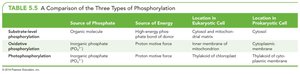
The energy released from catabolic reactions is stored in ATP through phosphorylation. There are three main types of phosphorylation:
Type | Source of Phosphate | Source of Energy | Location in Eukaryotes | Location in Prokaryotes |
|---|---|---|---|---|
Substrate-level | Organic molecule | High-energy phosphate bond | Cytosol and mitochondrial matrix | Cytoplasm |
Oxidative | Inorganic phosphate | Proton motive force | Inner mitochondrial membrane | Cytoplasmic membrane |
Photophosphorylation | Inorganic phosphate | Proton motive force (light-driven) | Thylakoid of chloroplast | Thylakoid of cyanobacteria |
Catabolic Pathways
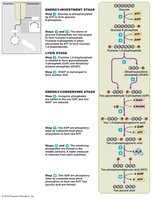
Glycolysis (Embden-Meyerhof Pathway)
Glycolysis is the central pathway for glucose catabolism, occurring in the cytoplasm of both prokaryotes and eukaryotes. It converts one glucose molecule into two pyruvate molecules, generating ATP and NADH.
Energy Investment: 2 ATP used.
Lysis: 6-carbon glucose split into two 3-carbon molecules.
Energy Payoff: 4 ATP produced (net gain: 2 ATP), 2 NADH, 2 pyruvate.
Alternative Pathways
Entner-Doudoroff Pathway: Found in some prokaryotes; yields 1 ATP and 1 NADPH per glucose.
Pentose Phosphate Pathway: Fo
und in both prokaryotes and eukaryotes; yields 1 ATP and 1 NADPH, important for biosynthesis.
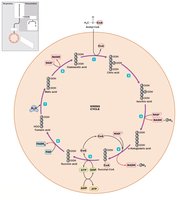
Krebs Cycle (Citric Acid Cycle)
Before entering the Krebs cycle, pyruvate is converted to acetyl-CoA. The cycle completes the oxidation of glucose derivatives, producing NADH, FADH2, ATP, and CO2.
Location: Mitochondrial matrix (eukaryotes), cytoplasm (prokaryotes).
Products per glucose: 6 NADH, 2 FADH2, 2 ATP, 4 CO2.
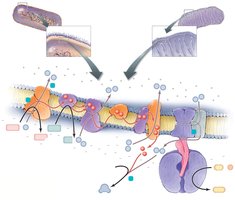
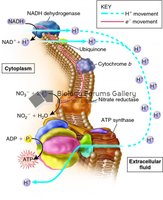
Electron Transport Chain (ETC) and Oxidative Phosphorylation
The ETC is a series of membrane-bound proteins and coenzymes that transfer electrons from NADH and FADH2 to a final electron acceptor, generating a proton gradient used to synthesize ATP.
Location: Inner mitochondrial membrane (eukaryotes), plasma membrane (prokaryotes).
Proton Motive Force: H+ ions are pumped across the membrane, creating an electrochemical gradient.
ATP Synthase: Enzyme that uses the proton gradient to produce ATP.
Final Electron Acceptor: Oxygen in aerobic respiration (forms water).
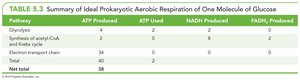
Summary of ATP Yield in Aerobic Respiration
Pathway | ATP Produced | ATP Used | NADH Produced | FADH2 Produced |
|---|---|---|---|---|
Glycolysis | 4 | 2 | 2 | 0 |
Synthesis of acetyl-CoA and Krebs cycle | 2 | 0 | 8 | 2 |
Electron transport chain | 34 | 0 | 0 | 0 |
Net total | 38 |
Anaerobic Respiration
In anaerobic respiration, the final electron acceptor is an inorganic molecule other than oxygen (e.g., nitrate, sulfate, carbonate). The amount of ATP generated is less than in aerobic respiration.
ATP Yield: Varies from 2 to 36 ATP per glucose.
Example: Escherichia coli can use nitrate as a terminal electron acceptor.
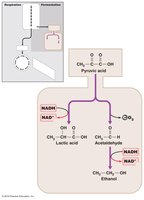
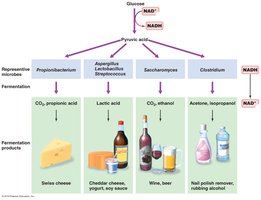
Fermentation
Fermentation is an anaerobic process that allows cells to regenerate NAD+ from NADH, enabling glycolysis to continue. The final electron acceptor is an organic molecule, and the process yields various end-products.
Lactic Acid Fermentation: Pyruvate is reduced to lactic acid (e.g., in bacteria, muscle cells).
Ethanol Fermentation: Pyruvate is converted to ethanol and CO2 (e.g., in yeast).
ATP Yield: Only 2 ATP per glucose.
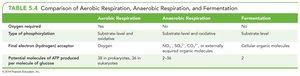
Comparison of Catabolic Pathways
Aerobic Respiration | Anaerobic Respiration | Fermentation | |
|---|---|---|---|
Oxygen required? | Yes | No | No |
Type of phosphorylation | Substrate-level and oxidative | Substrate-level and oxidative | Substrate-level |
Final electron acceptor | Oxygen | NO3-, SO4^2-, CO3^2-, or externally acquired organic molecules | Cellular organic molecules |
ATP yield per glucose | 38 (prokaryotes), 36 (eukaryotes) | 2–36 | 2 |
Anabolism and Integrated Metabolic Pathways
Anabolism
Anabolism refers to the synthesis of macromolecules from smaller precursors, requiring energy input (usually from ATP or NADPH). Many anabolic pathways are the reverse of catabolic pathways (e.g., gluconeogenesis is the reverse of glycolysis).
Gluconeogenesis: Synthesis of glucose from non-carbohydrate precursors.
Macromolecule Synthesis: Formation of proteins, nucleic acids, lipids, and polysaccharides.
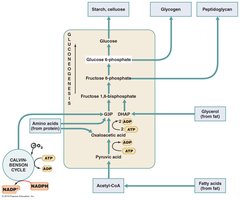
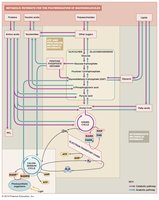
Integrated Metabolic Pathways
Metabolic pathways are interconnected, allowing cells to adapt to different nutrient sources and energy demands. Intermediates from catabolic pathways can be diverted into anabolic pathways for biosynthesis.
Classification of Microorganisms by Metabolism
Energy and Carbon Sources
Microorganisms are classified based on their energy and carbon sources:
Phototrophs: Use light as an energy source.
Chemotrophs: Use chemicals as an energy source.
Autotrophs: Use CO2 as a carbon source.
Heterotrophs: Use organic compounds as a carbon source.
Examples include photoautotrophs (plants, algae), chemoheterotrophs (animals, most bacteria), and others.
