 Back
BackConsumer Behaviour: Utility, Demand, and Consumer Surplus
Study Guide - Smart Notes
 Tailored notes based on your materials, expanded with key definitions, examples, and context.
Chapter 6: Consumer Behaviour
6.1 Marginal Utility and Consumer Choice
Understanding consumer behaviour begins with the concept of utility, which measures the satisfaction a consumer receives from consuming goods and services. This section explores how consumers make choices to maximize their satisfaction given their income and market prices.
Utility: The satisfaction or pleasure a consumer derives from consuming a product.
Total Utility: The total satisfaction received from consuming a certain quantity of a product.
Marginal Utility: The additional satisfaction gained from consuming one more unit of a product.
Diminishing Marginal Utility: As a consumer consumes more units of a good, the additional satisfaction from each extra unit decreases.
Example: Drinking water when thirsty provides high utility initially, but as more water is consumed, the marginal utility from each additional glass decreases.
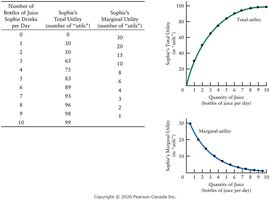
Utility Schedules and Graphs
Utility schedules and graphs visually represent how total and marginal utility change as consumption increases. These tools help illustrate the principle of diminishing marginal utility.
Maximizing Utility
Consumers aim to allocate their income in a way that maximizes their total utility, given the prices of goods and their budget constraints. The utility-maximizing rule states that consumers should equalize the marginal utility per dollar spent across all goods.
Utility-Maximizing Condition (for two goods X and Y):
Where MU is marginal utility and P is price.
If the marginal utility per dollar spent on one good is higher than another, the consumer should buy more of the former and less of the latter until equality is achieved.
Example: If Zoe gets more utility per dollar from tea than from milk, she should buy more tea and less milk until the marginal utility per dollar is equalized.
Rationality and Framing in Consumer Behaviour
Economists often assume consumers are rational and adjust their behaviour to maximize utility. However, behavioural economics shows that the way choices are presented (framing) can influence decisions, leading to policy interventions known as "nudges" that guide choices without restricting freedom.
The Consumer’s Demand Curve
The theory of consumer behaviour predicts that as the price of a good rises, the quantity demanded falls, and vice versa. This is due to diminishing marginal utility: as consumers buy less of a good, the marginal utility of the last unit increases, restoring the utility-maximizing condition.
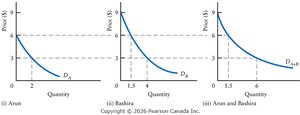
The market demand curve is the horizontal sum of all individual demand curves.
6.2 Income and Substitution Effects of Price Changes
Income and Substitution Effects
A change in the price of a good affects consumer choices through two channels: the substitution effect and the income effect.
Real Income: Income measured in terms of the purchasing power of money income.
Substitution Effect: The change in quantity demanded resulting from a change in the relative price of a good, holding real income constant. When the price of a good falls, consumers substitute it for other goods, increasing its quantity demanded.
Income Effect: The change in quantity demanded resulting from a change in real income, holding relative prices constant. If the good is normal, a price fall increases real income and quantity demanded.
The Slope of the Demand Curve
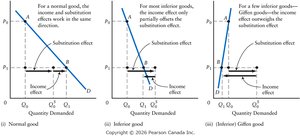
The combined operation of the income and substitution effects explains why the demand curve for a normal good is negatively sloped. For normal goods, both effects work in the same direction: a price fall increases quantity demanded.
Giffen Goods: Exceptionally, some inferior goods (Giffen goods) may have a positively sloped demand curve if the income effect outweighs the substitution effect. These goods must be inferior and constitute a large portion of household expenditure.
Conspicuous Consumption Goods: Goods bought for their "snob appeal". While some consumers may buy more at higher prices for status, overall market demand is unlikely to be positively sloped due to offsetting behaviour by other consumers.
6.3 Consumer Surplus
The Concept of Consumer Surplus
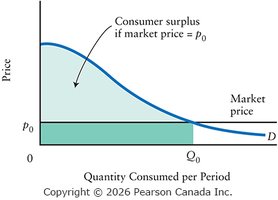
Consumer surplus is the difference between the total value consumers place on a good and the amount they actually pay. It represents the net benefit or "profit" consumers receive from market transactions.
Consumer surplus is visually represented as the area under the demand curve and above the market price line for the quantity purchased.
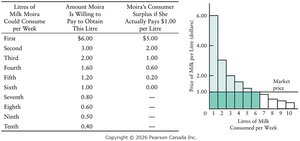
Identifying Consumer Surplus
The area under the demand curve shows the total value consumers place on a good. The area between the demand curve and the price line for a given quantity is the consumer surplus.
The Paradox of Value
Understanding the Paradox
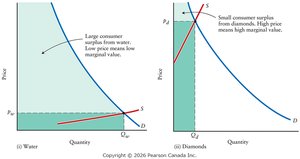
The paradox of value asks why essential goods like water have low prices, while non-essential goods like diamonds have high prices. Early economists believed price depended only on demand, but this view ignored the role of supply and marginal utility.
Price is determined by both supply and demand.
Consumers purchase units of a good until the marginal value of the last unit equals its market price.
Water is abundant, so its price and marginal value are low, but its total value is high. Diamonds are scarce, so their price and marginal value are high, but their total value is low.
Additional info: The paradox of value is resolved by distinguishing between total utility (overall satisfaction) and marginal utility (satisfaction from the last unit consumed). Market price reflects marginal, not total, utility.
