 Back
Backchapter 10 microecon
Study Guide - Smart Notes
 Tailored notes based on your materials, expanded with key definitions, examples, and context.
Consumer Choice and Behavioral Economics
Introduction to Consumer Choice
Consumer choice theory explores how individuals make decisions to allocate their limited resources among various goods and services to maximize their satisfaction, or utility. This chapter investigates the principles underlying consumer behavior, the concept of utility, and the influence of behavioral economics on decision-making.
Utility and Consumer Preferences
Utility: Definition and Measurement
Utility is the enjoyment or satisfaction a consumer receives from consuming goods and services.
Utility is subjective and varies between individuals based on tastes and preferences.
Economists use the hypothetical unit util to measure utility, though it cannot be compared across individuals.
Consumers aim to maximize their total utility given their budget constraints.
Example: Choosing between a red and yellow Bugatti, a consumer selects the red one because it provides higher utility, even if it is more expensive.
Total and Marginal Utility
Total Utility (TU): The total satisfaction received from consuming a certain quantity of a good or service.
Marginal Utility (MU): The additional utility gained from consuming one more unit of a good or service.
Law of Diminishing Marginal Utility: As more of a good is consumed, the additional satisfaction from each extra unit decreases.
Example: The first beverage at a party provides 20 utils, the second 16, the third 10, and so on, eventually turning negative if overconsumed.
Budget Constraints and Utility Maximization
Budget Constraint
A budget constraint represents the limited income available to spend on goods and services.
Consumers face trade-offs due to scarcity of resources.
Maximizing Utility: The Rule of Equal Marginal Utility per Dollar
To maximize utility, consumers allocate their budget so that the last dollar spent on each good provides the same marginal utility.
Where and are the marginal utilities of goods A and B, and and are their prices.
Consumers adjust their consumption until this condition is met, subject to their budget constraint.
Application: Choosing Between Beer and Pizza
Given a budget and prices for beer and pizza, consumers calculate marginal utility per dollar for each good and allocate spending to maximize total utility.
If the marginal utility per dollar is not equal, consume more of the good with the higher marginal utility per dollar and less of the other.
Demand Curves and Market Demand
Individual and Market Demand Curves
Individual demand curves are derived from the optimal consumption choices at different prices.
The market demand curve is the horizontal sum of all individual demand curves.
Social Influences and Fairness in Consumer Choice
Social Influences
Consumer choices are affected by social factors such as culture, customs, peer behavior, and celebrity endorsements.
Network Externalities: The usefulness of a product increases as more people use it (e.g., cell phones, social media platforms).
Fairness
Many consumers value fairness and may make decisions that do not maximize material gain if they perceive an action as unfair.
Examples include tipping, charitable donations, and responses to price increases after natural disasters.
Behavioral Economics: Common Pitfalls in Decision-Making
Three Common Pitfalls
Ignoring Nonmonetary Opportunity Costs: Consumers often overlook the value of alternatives that do not involve direct monetary costs (e.g., not selling a valuable ticket they own).
Failure to Ignore Sunk Costs: Sunk costs are past expenses that cannot be recovered and should not affect current decisions.
Unrealistic About Future Behavior: Consumers may overestimate their ability to change future behavior, leading to choices that conflict with long-term goals (e.g., procrastination, overeating).
Special Cases: Giffen Goods
Giffen Good: An inferior good for which an increase in price leads to an increase in quantity demanded, resulting in an upward-sloping demand curve.
All Giffen goods are inferior goods, but not all inferior goods are Giffen goods.
Appendix: Indifference Curves and Budget Constraints
Indifference Curves
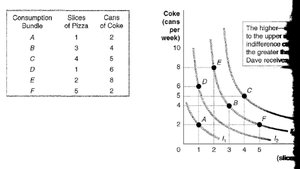
An indifference curve shows all combinations of two goods that provide the consumer with the same level of utility.
Consumers can rank bundles and their preferences are transitive.
Indifference curves never cross and are typically convex to the origin due to diminishing marginal rate of substitution (MRS).
Marginal Rate of Substitution (MRS): The rate at which a consumer is willing to trade one good for another while maintaining the same utility.
Consumption Bundle | Slices of Pizza | Cans of Coke |
|---|---|---|
A | 1 | 8 |
B | 2 | 6 |
C | 3 | 4 |
D | 4 | 2 |
E | 5 | 2 |
F | 5 | 6 |
Budget Constraints
The budget constraint shows all combinations of goods a consumer can afford given their income and the prices of goods.
The optimal consumption point is where the highest indifference curve is tangent to the budget constraint.
Consumption Bundle | Slices of Pizza | Cans of Coke | Total Spending ($) |
|---|---|---|---|
G | 0 | 10 | 10.00 |
H | 2 | 8 | 10.00 |
I | 4 | 6 | 10.00 |
J | 6 | 4 | 10.00 |
K | 8 | 2 | 10.00 |
L | 10 | 0 | 10.00 |
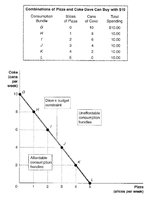
The slope of the budget constraint reflects the relative prices of the two goods.
Consumers seek to reach the highest possible indifference curve within their budget.
Additional info: The graphical analysis of indifference curves and budget constraints helps visualize consumer equilibrium and the effects of changes in income or prices on optimal consumption choices.
