 Back
BackDemand, Supply, and Price: Microeconomics Study Guide
Study Guide - Smart Notes
 Tailored notes based on your materials, expanded with key definitions, examples, and context.
Demand, Supply, and Price
Introduction
This chapter explores the fundamental concepts of demand, supply, and price determination in microeconomics. Understanding these concepts is essential for analyzing how markets function and how prices are set through the interaction of buyers and sellers.
Demand
Quantity Demanded
The quantity demanded of a product is the total amount that consumers wish to purchase in a given time period. It is a flow variable (e.g., 10 apples per day), not a stock variable (e.g., 10 apples at a specific moment). Quantity demanded is influenced by several factors, including the product’s own price, consumer income, prices of other goods, preferences, and weather. To analyze the effect of one variable, economists use the ceteris paribus assumption, holding all other variables constant.
Quantity Demanded and Price
There is a negative relationship between price and quantity demanded, ceteris paribus. As price decreases, quantity demanded increases, and vice versa. This is because consumers substitute cheaper products for more expensive ones.
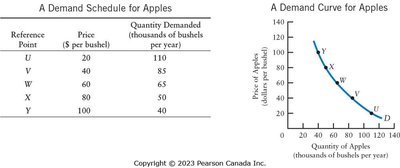
Demand Schedules and Demand Curves
A demand schedule is a table showing the quantity demanded at various prices. A demand curve is a graphical representation of this relationship, with price on the vertical axis and quantity on the horizontal axis. The demand curve typically slopes downward.
Distinction between "Demand" and "Quantity Demanded"
Demand refers to the entire relationship between price and quantity demanded, represented by the demand curve.
Quantity demanded refers to a specific point on the demand curve at a particular price.
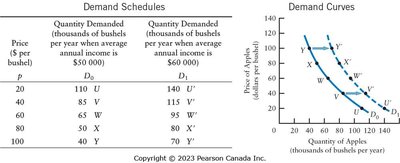
Shifts in Demand Curves
A change in the price of a good leads to a movement along the demand curve. Changes in other variables (income, prices of other goods, preferences, population, weather) shift the demand curve.
Increase in income: Demand curve shifts right (demand increases).
Decrease in price of substitutes: Demand curve shifts left (demand decreases).
Decrease in price of complements: Demand curve shifts right (demand increases).
Change in preferences: Demand curve shifts left or right depending on taste.
Population increase: Demand curve shifts right.
Weather changes: Demand curve shifts left or right depending on product.
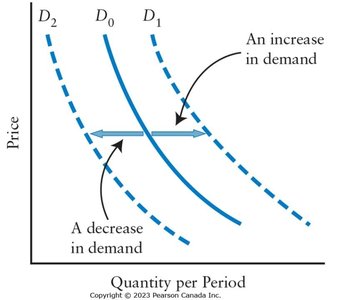
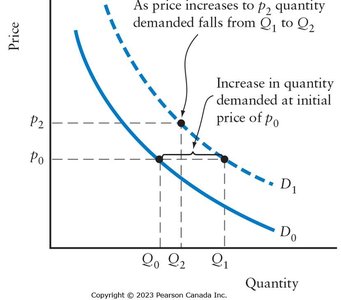
Shifts vs. Movements Along the Demand Curve
A movement along the demand curve is caused by a change in the product’s price. A shift of the demand curve is caused by changes in other variables.
Supply
Quantity Supplied
The quantity supplied is the amount of a product that firms wish to sell in a given time period. It is also a flow variable. Quantity supplied is influenced by the product’s price, input prices, technology, taxes and subsidies, prices of other products, number of suppliers, and weather. The ceteris paribus assumption is used to isolate the effect of one variable.
Quantity Supplied and Price
There is a positive relationship between price and quantity supplied, ceteris paribus. As price increases, quantity supplied increases, and vice versa. Higher prices make production more profitable.
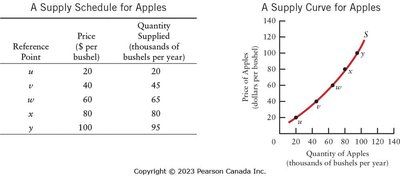
Supply Schedules and Supply Curves
A supply schedule is a table showing quantity supplied at various prices. A supply curve is a graph of this relationship, typically sloping upward.
Distinction between "Supply" and "Quantity Supplied"
Supply refers to the entire relationship between price and quantity supplied, represented by the supply curve.
Quantity supplied refers to a specific point on the supply curve at a particular price.
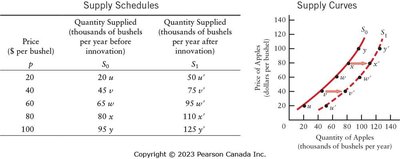
Shifts in Supply Curves
A change in the price of a product leads to a movement along the supply curve. Changes in other variables (technology, input prices, taxes/subsidies, prices of other products, number of suppliers, weather) shift the supply curve.
Cost-saving technology: Supply curve shifts right (supply increases).
Increase in input prices: Supply curve shifts left (supply decreases).
Taxes: Supply curve shifts left (supply decreases).
Subsidies: Supply curve shifts right (supply increases).
Prices of other products: Substitutes in production cause supply curve to shift right or left.
Weather: Can shift supply curve right or left.
Number of suppliers: More suppliers shift supply curve right.
Shifts vs. Movements Along the Supply Curve
A movement along the supply curve is caused by a change in the product’s price. A shift of the supply curve is caused by changes in other variables.
The Determination of Price
Market Equilibrium
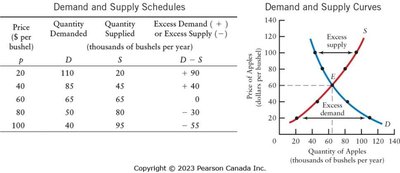
Market equilibrium occurs where quantity demanded equals quantity supplied. The equilibrium price is the price at which the market “clears.” At prices above equilibrium, there is excess supply; at prices below equilibrium, there is excess demand.


Changes in Market Equilibrium
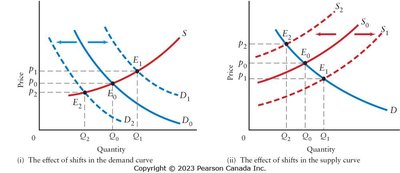
Comparative statics is used to predict how equilibrium price and quantity change when an exogenous variable changes. Four possible shifts:
Increase in demand: Equilibrium price and quantity increase.
Decrease in demand: Equilibrium price and quantity decrease.
Increase in supply: Equilibrium price decreases, equilibrium quantity increases.
Decrease in supply: Equilibrium price increases, equilibrium quantity decreases.
Market Equilibrium with Algebra
Market equilibrium can be determined algebraically by setting the demand and supply equations equal to each other:
Suppose demand:
Suppose supply:
Set :
Equilibrium price is $16.
Absolute vs. Relative Prices
Definitions
Absolute price: The monetary amount required to purchase one unit of a product.
Relative price: The price of one good in terms of another, calculated as the ratio of their absolute prices.
Example: If apples cost \frac{1}{2}$.
Importance of Relative Price Changes
Relative price changes can lead to substitution between products. If all absolute prices rise equally, relative prices do not change and no substitution occurs.
Limitations of the Demand-and-Supply Model
Applicability
The demand-and-supply model is useful for many markets but has limitations. It is best applied to markets with perfect competition, which require:
Many consumers, each small relative to the market.
Many producers, each small relative to the market.
Homogeneous products.
Markets for differentiated products (e.g., iPhones) do not satisfy these conditions.
Summary Table: Demand and Supply Schedules
Price ($ per bushel) | Quantity Demanded | Quantity Supplied | Excess Demand (+) or Excess Supply (-) |
|---|---|---|---|
20 | 110 | 20 | +90 |
40 | 85 | 45 | +40 |
60 | 65 | 65 | 0 |
80 | 50 | 80 | -30 |
100 | 40 | 95 | -55 |
Equilibrium occurs at price $60$ where quantity demanded equals quantity supplied.
