 Back
BackEconomic Efficiency, Government Price Setting, and Taxes: Microeconomics Study Notes
Study Guide - Smart Notes
 Tailored notes based on your materials, expanded with key definitions, examples, and context.
Economic Efficiency, Government Price Setting, and Taxes
4.1 Consumer Surplus and Producer Surplus
In microeconomics, consumer surplus and producer surplus are key concepts used to measure the benefits that buyers and sellers receive from participating in a market.
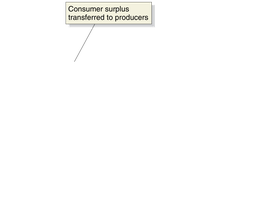
Consumer Surplus: The difference between the highest price a consumer is willing to pay for a good or service and the actual price paid. It represents the net benefit to consumers from market transactions.
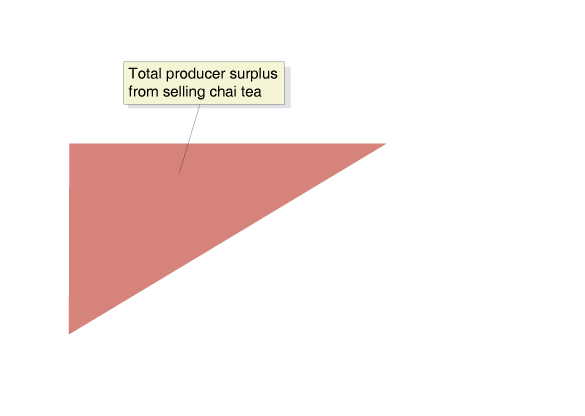
Producer Surplus: The difference between the lowest price a firm would accept for a good or service (usually the marginal cost) and the price it actually receives. It measures the net benefit to producers.
Marginal Benefit: The additional benefit to a consumer from consuming one more unit of a good or service.
Marginal Cost: The additional cost to a firm of producing one more unit of a good or service.
Example: If a consumer is willing to pay $5 for a cup of tea but pays only $3, the consumer surplus is $2.
4.2 The Efficiency of Competitive Markets
Economic efficiency in a market is achieved when resources are allocated in a way that maximizes the total net benefit to society, measured as the sum of consumer and producer surplus (economic surplus).
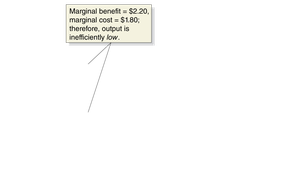
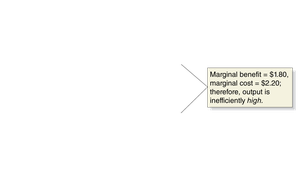
Economic Efficiency: Occurs when all trades take place where the marginal benefit exceeds the marginal cost, and no other trades occur. At this point, economic surplus is maximized.
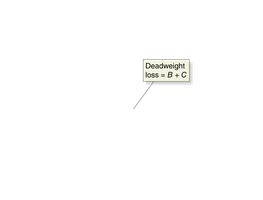
Deadweight Loss: The reduction in economic surplus resulting from a market not being in competitive equilibrium. It represents the loss of potential gains from trade.
Example: If the price is set above or below equilibrium, some mutually beneficial trades do not occur, resulting in deadweight loss.
4.3 Government Intervention in the Market: Price Floors and Price Ceilings
Governments may intervene in markets by imposing price floors (minimum prices) or price ceilings (maximum prices). These interventions can lead to inefficiencies and deadweight loss.
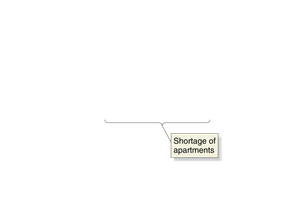
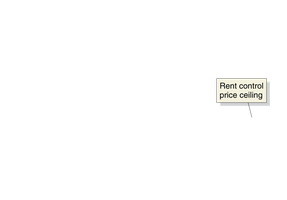
Price Ceiling: A legally determined maximum price that sellers can charge (e.g., rent control).
Price Floor: A legally determined minimum price that sellers may receive (e.g., minimum wage, agricultural price supports).
Price controls can create shortages (price ceilings) or surpluses (price floors).
Example: Rent control may make apartments more affordable for some, but can also lead to shortages and reduced quality of rental housing.


4.4 The Economic Effect of Taxes
Taxes are a primary means for governments to raise revenue, but they also affect market outcomes by shifting supply or demand curves, changing equilibrium prices and quantities, and creating deadweight loss.
Per-Unit Tax: A tax assessed as a fixed amount per unit sold (e.g., $1 per pack of cigarettes).
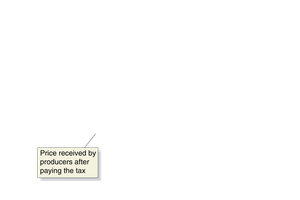
Tax Incidence: The actual division of the burden of a tax between buyers and sellers, determined by the relative elasticities of supply and demand, not by legal assignment.
Taxes generally reduce both consumer and producer surplus, with part of the loss becoming government revenue and part becoming deadweight loss.
Example: A $1 tax on cigarettes shifts the supply curve up by $1, raising the price for consumers and lowering the price received by producers.


Appendix: Quantitative Demand and Supply Analysis
Quantitative analysis involves using algebraic equations for demand and supply to determine equilibrium price and quantity, as well as the effects of government interventions.
Equilibrium Condition:
Consumer Surplus (CS): Area below the demand curve and above the price, up to the equilibrium quantity.
Producer Surplus (PS): Area above the supply curve and below the price, up to the equilibrium quantity.
Deadweight Loss (DWL): Area representing lost surplus due to market inefficiency (e.g., from price controls or taxes).
Example: For the New York City apartment market:
Demand:
Supply:
Equilibrium price:
Equilibrium quantity:
Consumer Surplus: million
Producer Surplus: million


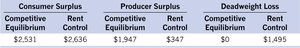
Summary Table: Effects of Rent Control
Consumer Surplus | Producer Surplus | Deadweight Loss | |
|---|---|---|---|
Competitive Equilibrium | $2,531 million | $1,947 million | $0 |
Rent Control | $2,636 million | $347 million | $1,495 million |
Additional info: The above table summarizes the changes in consumer surplus, producer surplus, and deadweight loss when rent control is imposed, based on the quantitative analysis provided in the appendix.
