 Back
Backchapter 4 microecon
Study Guide - Smart Notes
 Tailored notes based on your materials, expanded with key definitions, examples, and context.
Economic Efficiency and Market Equilibrium
Market Equilibrium
Market equilibrium occurs when the quantity demanded (QD) equals the quantity supplied (QS), resulting in a stable market price. At equilibrium, every consumer willing to pay the market price can purchase the desired quantity, and every firm willing to accept the market price can sell as much as it wants.
Equilibrium Price (P*): The price at which QD = QS.
Equilibrium Quantity (Q*): The quantity at which the supply and demand curves intersect.
Economic Efficiency: Achieved when the market is at equilibrium, maximizing total benefit to society.
At equilibrium, the marginal benefit (MB) to consumers equals the marginal cost (MC) to producers.
Government Interventions: Price Ceilings and Price Floors
Price Ceilings
A price ceiling is a legally determined maximum price that sellers may charge. It is binding only if set below the equilibrium price, resulting in shortages (QD > QS).
Purpose: Intended to help consumers by lowering prices.
Effects: Not all consumers benefit; shortages occur.
Surplus Transfer: Producer surplus is transferred to consumers.
Black Markets: May emerge when prices violate the ceiling.
Example: Rent control in major cities.
Price Floors
A price floor is a legally determined minimum price that sellers receive. It is binding only if set above the equilibrium price, resulting in surpluses (QS > QD).
Purpose: Intended to help producers by raising prices.
Effects: Not all producers benefit; surpluses occur.
Surplus Transfer: Consumer surplus is transferred to producers.
Black Markets: May emerge when prices violate the floor.
Example: Minimum wage laws.
Surplus Concepts and Graphical Representation
Consumer Surplus (CS)
Consumer surplus is the difference between the highest price a consumer is willing to pay and the price actually paid. It measures the net benefit to consumers from market participation.
Graphical Area: Area below the demand curve and above the market price, up to the quantity bought.
Formula:
Example: If a consumer is willing to pay $50 for a shirt but buys it for $35, the consumer surplus is $15.
Producer Surplus (PS)
Producer surplus is the difference between the lowest price a firm is willing to accept and the price it actually receives. It measures the net benefit to producers from market participation.
Graphical Area: Area above the supply curve and below the market price, up to the quantity sold.
Formula:
Economic Surplus (ES)
Economic surplus is the sum of consumer surplus and producer surplus. It represents the total benefit to society from market transactions.
Formula:
Maximized: When the market is in equilibrium.
Marginal Benefit and Marginal Cost
Marginal Benefit (MB): Additional benefit to a consumer from consuming one more unit.
Marginal Cost (MC): Additional cost to a producer from producing one more unit.
Equilibrium: Occurs where MB = MC.
Deadweight Loss
Deadweight loss is the reduction in economic surplus resulting from a market not being in equilibrium, often due to government intervention.
Graphical Area: Area lost between the supply and demand curves when price floors or ceilings are imposed.
Graphical Example: Surplus Areas
The following graph illustrates consumer surplus, producer surplus, and economic surplus at equilibrium and under price controls:
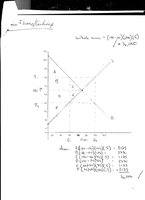
Key Points from the Graph:
Areas A, B, C: Consumer surplus at equilibrium
Areas D, E: Producer surplus at equilibrium
Economic surplus is maximized at equilibrium
Price floors and ceilings reduce economic surplus and create deadweight loss
Effects of Price Floors and Ceilings: Numerical Example
Price Floor Example
Equilibrium: P* = $100, Q* = 200
Consumer Surplus:
Producer Surplus:
Economic Surplus:
With Price Floor at $130: Economic surplus drops to $13,750, deadweight loss = $2,250
Price Ceiling Example
With Price Ceiling at $70: Economic surplus drops to $13,750, deadweight loss = $2,250
Government Intervention: Taxes
Tax Incidence
Tax incidence refers to the division of the burden of a tax between buyers and sellers. The actual burden depends on the relative elasticities of supply and demand.
Tax Revenue:
Deadweight Loss: Part of the reduction in consumer and producer surplus that is not converted to tax revenue.
Efficiency: A tax is considered efficient if tax revenue exceeds deadweight loss.
Graphical Example: Tax Effects
The following graph illustrates the effects of a tax on supply and demand, showing the division of tax burden and deadweight loss:
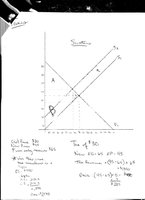
Tax shifts the supply curve upward by the amount of the tax
Consumer and producer surplus decrease
Some surplus becomes tax revenue; the rest is deadweight loss
Solving for Equilibrium and Surpluses Using Equations
Supply and Demand Equations
Supply:
Demand:
Equilibrium: Set and solve for P and Q
Example Solution:
Calculating Surpluses
Producer Surplus: Area above supply curve and below price line
Consumer Surplus: Area below demand curve and above price line
Economic Surplus: Sum of CS and PS
Conclusion
Government interventions such as price ceilings, price floors, and taxes reduce economic efficiency by decreasing economic surplus and creating deadweight loss. While some individuals may benefit, society as a whole is worse off when markets are not allowed to reach equilibrium.
