 Back
Back4. Elasticity in Microeconomics: Price, Income, and Cross Elasticities of Demand and Supply
Study Guide - Smart Notes
 Tailored notes based on your materials, expanded with key definitions, examples, and context.
Elasticity in Microeconomics
Introduction to Elasticity
Elasticity is a central concept in microeconomics that measures how much one variable responds to changes in another variable. In the context of markets, elasticity quantifies the responsiveness of quantity demanded or supplied to changes in price, income, or the price of related goods. Understanding elasticity helps explain consumer and producer behavior, and informs policy decisions.
Price Elasticity of Demand
Definition and Calculation
The price elasticity of demand measures the responsiveness of the quantity demanded of a good to a change in its price. It is calculated as:
Formula:
The midpoint method is commonly used to calculate percentage changes between two points:
Example: If the price of iPhones increases from $400 to $600 and quantity demanded falls from 10,600 to 8,400, use the midpoint method to calculate elasticity.
Factors Influencing Price Elasticity of Demand
Several factors determine how elastic demand is for a good:
Availability of close substitutes: Goods with many substitutes (e.g., Fanta among soft drinks) have higher elasticity.
Necessities vs. Luxuries: Necessities (e.g., insulin) tend to have inelastic demand, while luxuries (e.g., Rolex watches) are more elastic.
Definition of the market: Narrowly defined goods (e.g., Fanta) are more elastic than broadly defined categories (e.g., all soft drinks).
Time horizon: Demand is more elastic in the long run as consumers have more time to adjust their behavior.


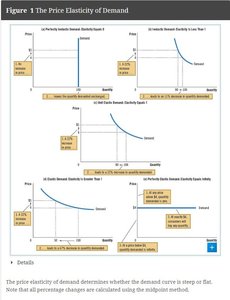
Types of Price Elasticity of Demand
Perfectly inelastic: (vertical demand curve; quantity demanded does not change with price)
Inelastic: (quantity demanded changes less than proportionally to price)
Unit elastic: (quantity demanded changes exactly proportionally to price)
Elastic: (quantity demanded changes more than proportionally to price)
Perfectly elastic: (horizontal demand curve; any price increase drops quantity demanded to zero)
Elasticity Along a Linear Demand Curve
Although the slope of a linear demand curve is constant, elasticity varies along the curve. Elasticity is higher at higher prices and lower quantities, and lower at lower prices and higher quantities.
Elasticity and Total Revenue
Total revenue is the product of price and quantity sold (). The relationship between elasticity and total revenue is as follows:
If demand is inelastic (), an increase in price increases total revenue.
If demand is elastic (), an increase in price decreases total revenue.
If demand is unit elastic (), total revenue is maximized and does not change with price.
Applications of Price Elasticity of Demand
Public Policy: Understanding elasticity helps predict the effects of taxes, subsidies, and price controls.
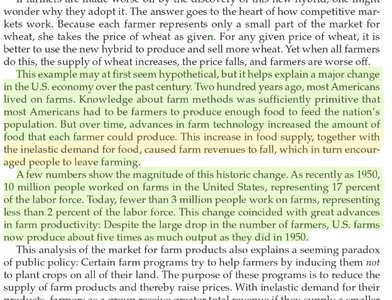
Agriculture: Technological advances that increase supply can lower total revenue if demand is inelastic (e.g., wheat farming).

Other Elasticities of Demand
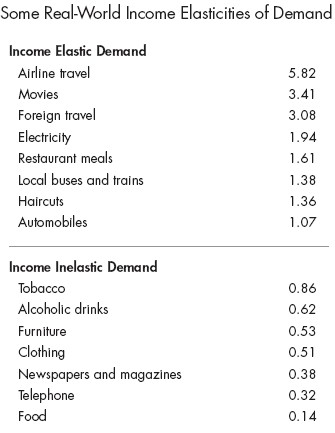
Income Elasticity of Demand
The income elasticity of demand measures the responsiveness of quantity demanded to changes in consumer income:
Normal goods: Positive income elasticity (demand increases as income rises).
Inferior goods: Negative income elasticity (demand decreases as income rises).
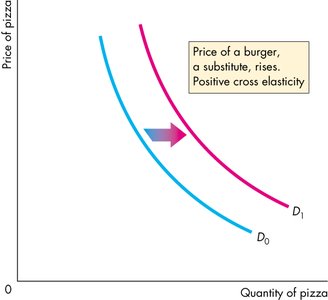
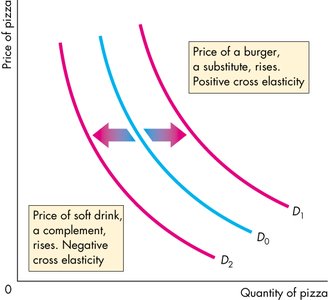
Cross-Price Elasticity of Demand
The cross-price elasticity of demand measures the responsiveness of demand for one good to changes in the price of another good:
Substitutes: Positive cross-price elasticity (e.g., pizza and burgers).
Complements: Negative cross-price elasticity (e.g., pizza and soft drinks).
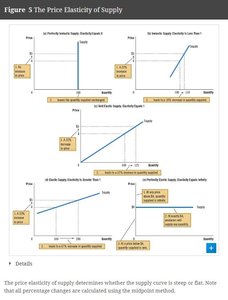
Price Elasticity of Supply
Definition and Calculation
The price elasticity of supply measures the responsiveness of the quantity supplied of a good to a change in its price:
Supply is elastic if elasticity > 1, inelastic if elasticity < 1, perfectly inelastic if elasticity = 0, and perfectly elastic if elasticity = ∞.
Factors Influencing Price Elasticity of Supply
Flexibility of production: The more easily producers can change the quantity produced, the more elastic supply is.
Time horizon: Supply is more elastic in the long run as firms can adjust all inputs.
Capacity constraints: As output increases, supply may become less elastic due to limited resources.
Practice Problems and Applications
Worked Examples
Calculating elasticity using the midpoint method for different scenarios (e.g., airline tickets, heating oil).
Comparing elasticities for different consumer groups (e.g., business travelers vs. vacationers).
Analyzing the impact of price changes on total revenue and consumer behavior over different time horizons.
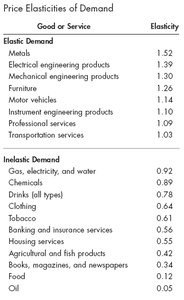
Summary Table: Price Elasticities of Demand for Selected Goods
Good or Service | Elasticity |
|---|---|
Metals | 1.52 |
Motor vehicles | 1.14 |
Drinks (all types) | 0.78 |
Food | 0.24 |
Oil | 0.05 |
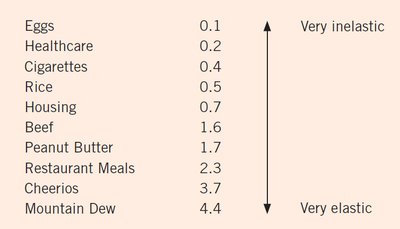
Cheerios | 3.7 |
Mountain Dew | 4.4 |
Eggs | 0.1 |
Additional info: Table entries are selected from the provided images and lecture notes to illustrate the range of elasticities across goods.
Key Takeaways
Elasticity is crucial for understanding market responses to price, income, and related goods' price changes.
Elasticity informs business pricing strategies and public policy decisions.
Elasticity varies by good, market definition, time horizon, and consumer preferences.
