 Back
BackElasticity: The Responsiveness of Demand and Supply
Study Guide - Smart Notes
 Tailored notes based on your materials, expanded with key definitions, examples, and context.
Elasticity: The Responsiveness of Demand and Supply
Introduction to Elasticity
Elasticity is a central concept in microeconomics, measuring how much one economic variable responds to changes in another. This chapter focuses on the price elasticity of demand and supply, as well as related elasticities, and their implications for markets and policy.
Price Elasticity of Demand
Definition and Measurement
The price elasticity of demand quantifies how much the quantity demanded of a good responds to a change in its price. It is calculated as the percentage change in quantity demanded divided by the percentage change in price:
Elasticity is a unit-free measure, allowing for comparison across goods and markets. The value is typically negative due to the inverse relationship between price and quantity demanded, but the absolute value is used for classification.
Elasticity Terminology
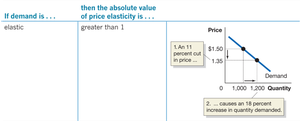
Elastic Demand: Absolute value greater than 1. Quantity demanded changes more than proportionally to price changes.
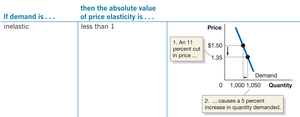
Inelastic Demand: Absolute value less than 1. Quantity demanded changes less than proportionally to price changes.
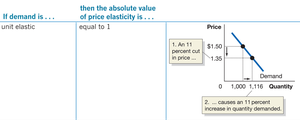
Unit-Elastic Demand: Absolute value equals 1. Quantity demanded changes exactly proportionally to price changes.
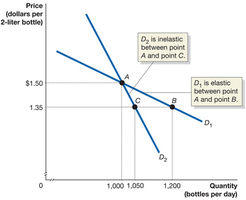
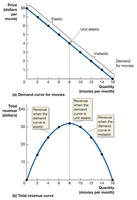
Graphical Representation
Elasticity varies along the demand curve. The same price change can result in different elasticities depending on the initial price and quantity.
The Midpoint Formula
To avoid ambiguity in calculating percentage changes, the midpoint formula is used:
This formula ensures consistent results regardless of the direction of the change.
Special Cases of Elasticity
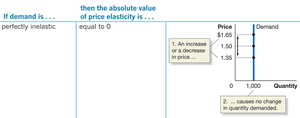
Perfectly Inelastic Demand: Elasticity equals 0. Quantity demanded does not change as price changes (vertical demand curve).
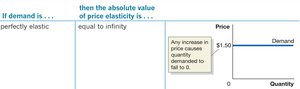
Perfectly Elastic Demand: Elasticity equals infinity. Any price increase causes quantity demanded to fall to zero (horizontal demand curve).
Summary Table: Price Elasticity of Demand
If demand is... | then the absolute value of price elasticity is... | Example/Graph |
|---|---|---|
Elastic | Greater than 1 |
|
Inelastic | Less than 1 |
|
Unit elastic | Equal to 1 |
|
Perfectly elastic | Equal to infinity |
|
Perfectly inelastic | Equal to 0 |
|
Determinants of Price Elasticity of Demand
Key Factors
Availability of Close Substitutes: More substitutes make demand more elastic.
Passage of Time: Demand is more elastic in the long run as consumers adjust.
Necessity vs. Luxury: Necessities tend to have inelastic demand; luxuries are more elastic.
Definition of the Market: Narrowly defined markets have more elastic demand.
Share of Budget: Goods that take a larger share of the consumer's budget have more elastic demand.
Elasticity and Total Revenue
Relationship Between Elasticity and Total Revenue
Total revenue is calculated as price times quantity sold. The effect of a price change on total revenue depends on the elasticity of demand:
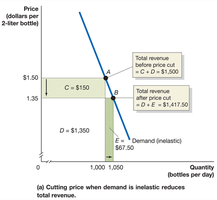
If demand is inelastic, a price decrease reduces total revenue.
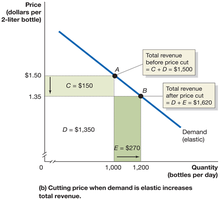
If demand is elastic, a price decrease increases total revenue.
If demand is unit elastic, total revenue remains unchanged when price changes.
Elasticity Along a Linear Demand Curve
Elasticity is not constant along a straight-line demand curve. It is higher (more elastic) at higher prices and lower quantities, and becomes inelastic at lower prices and higher quantities.
Other Demand Elasticities
Cross-Price Elasticity of Demand
The cross-price elasticity of demand measures the responsiveness of the quantity demanded for one good to a change in the price of another good:
Positive value: Goods are substitutes.
Negative value: Goods are complements.
Income Elasticity of Demand
The income elasticity of demand measures the responsiveness of quantity demanded to changes in income:
Positive value: Normal good (demand increases as income rises).
Negative value: Inferior good (demand decreases as income rises).
Price Elasticity of Supply
Definition and Measurement
The price elasticity of supply measures how much the quantity supplied of a good responds to a change in its price:
Like demand elasticity, the midpoint formula is often used for calculation.
Determinants of Price Elasticity of Supply
Time Period: Supply is more elastic in the long run as firms can adjust production.
Flexibility of Production: The easier it is to increase output, the more elastic supply is.
Special Cases of Supply Elasticity
Perfectly Inelastic Supply: Vertical supply curve; elasticity equals 0 (e.g., fixed number of parking spaces).
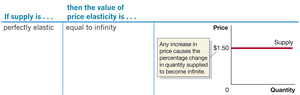
Perfectly Elastic Supply: Horizontal supply curve; elasticity equals infinity (e.g., long-run agricultural supply).
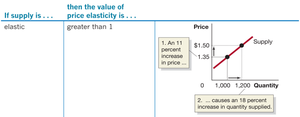
Summary Table: Price Elasticity of Supply
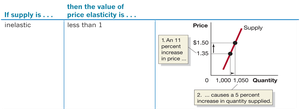
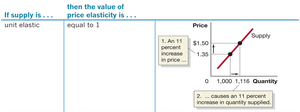
If supply is... | then the value of price elasticity is... | Example/Graph |
|---|---|---|
Elastic | Greater than 1 |
|
Inelastic | Less than 1 |
|
Unit elastic | Equal to 1 |
|
Perfectly elastic | Equal to infinity |
|
Applications and Policy Implications
Soda Taxes and Elasticity
Taxes on soda and sweetened beverages are intended to reduce consumption and raise revenue. The effectiveness of such taxes depends on the price elasticity of demand: if demand is elastic, consumption will fall significantly, but tax revenue may be lower than expected.

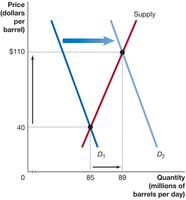
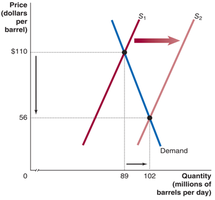
Elasticity in Other Markets
Elasticity concepts are widely used in policy and business, such as predicting the effects of law enforcement changes on crime rates, or understanding the impact of technological advances on oil prices.
Summary Table: Elasticities
Elasticity Type | Formula | Interpretation |
|---|---|---|
Price Elasticity of Demand | Responsiveness of quantity demanded to price changes | |
Cross-Price Elasticity of Demand | Relationship between substitutes and complements | |
Income Elasticity of Demand | Normal vs. inferior goods | |
Price Elasticity of Supply | Responsiveness of quantity supplied to price changes |
Additional info: This guide covers all major aspects of elasticity as presented in a typical microeconomics course, including definitions, determinants, graphical analysis, and real-world applications. The included images reinforce key concepts and provide visual examples of elasticity in demand and supply.
