 Back
BackElasticity: The Responsiveness of Demand and Supply
Study Guide - Smart Notes
 Tailored notes based on your materials, expanded with key definitions, examples, and context.
Elasticity: The Responsiveness of Demand and Supply
Definition and Importance of Elasticity
Elasticity is a fundamental concept in microeconomics that measures how much one economic variable responds to changes in another economic variable. The most common application is the price elasticity of demand, which quantifies how the quantity demanded of a good responds to changes in its price.
Elasticity: A measure of responsiveness between two variables.
Price Elasticity of Demand: The responsiveness of quantity demanded to a change in price.
Formula: $\text{Price Elasticity of Demand} = \frac{\%\ \text{Change in Quantity Demanded}}{\%\ \text{Change in Price}}$
Note: Elasticity is not the same as the slope of the demand curve.
Calculating Price Elasticity of Demand: The Midpoint Formula
To ensure consistency when measuring elasticity between two points on a demand curve, economists use the midpoint formula. This method calculates percentage changes based on the average of the starting and ending values.
Midpoint Formula: $\text{Price Elasticity of Demand} = \frac{\frac{Q_2 - Q_1}{(Q_2 + Q_1)/2}}{\frac{P_2 - P_1}{(P_2 + P_1)/2}}$
Percent Change (Midpoint Method): $\%\Delta X = \frac{\text{Change in } X}{\text{Average value of } X} \times 100$
Example: If the price of a sushi roll drops from $8 to $4 and sales rise from 20 to 40 units:
\(Q_1 = 20, Q_2 = 40, P_1 = 8, P_2 = 4\)
\(\text{Elasticity} = 1\) (unit elastic)
Types of Price Elasticity of Demand
The value of the price elasticity of demand determines whether demand is elastic, inelastic, or unit elastic. Special cases include perfectly elastic and perfectly inelastic demand.
Elastic Demand: Absolute value > 1. Quantity demanded changes more than price.
Inelastic Demand: Absolute value < 1. Quantity demanded changes less than price.
Unit Elastic Demand: Absolute value = 1. Quantity demanded changes exactly as price does.
Perfectly Elastic: Elasticity = infinity. Any price change leads to an infinite change in quantity demanded.
Perfectly Inelastic: Elasticity = 0. Quantity demanded does not respond to price changes.
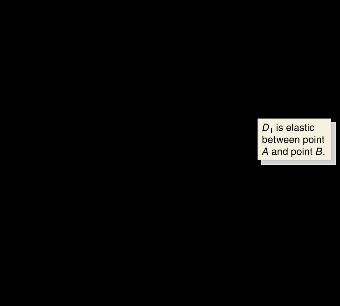
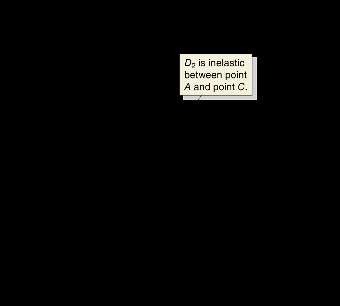
Graphical Representation of Elastic and Inelastic Demand
The steepness or flatness of a demand curve indicates its elasticity. Flatter curves are more elastic, while steeper curves are more inelastic.
Determinants of Price Elasticity of Demand
Several factors influence the price elasticity of demand for a good or service:
Availability of Close Substitutes: More substitutes make demand more elastic.
Passage of Time: Demand is more elastic in the long run as consumers can adjust their behavior.
Luxury vs. Necessity: Luxuries have more elastic demand; necessities are more inelastic.
Definition of the Market: Narrowly defined markets have more elastic demand due to more substitutes.
Share of a Good in Consumer’s Budget: Goods that take up a larger share of the budget have more elastic demand.
Applications and Examples
Understanding elasticity helps businesses and policymakers predict how changes in price will affect total revenue and market outcomes. For example, if the market for a product is broadly defined, there are few substitutes, and demand is relatively inelastic.
Example: If a 35% increase in the price of golf balls leads to a 42% decrease in quantity demanded, demand is relatively elastic (elasticity > 1).
Example: If the market for a product is broadly defined, demand is relatively inelastic due to fewer substitutes.
Real-World Price Elasticities of Demand
Different goods have different elasticities, reflecting consumer responsiveness to price changes. The table below summarizes estimated price elasticities for various products:
Product | Estimated Elasticity | Product | Estimated Elasticity |
|---|---|---|---|
Books (Barnes & Noble) | -4.00 | Bread | -0.40 |
Books (Amazon) | -0.60 | Water (residential use) | -0.38 |
DVDs (Amazon) | -3.10 | Chicken | -0.37 |
Post Raisin Bran | -2.50 | Cocaine | -0.28 |
Automobiles | -1.95 | Cigarettes | -0.25 |
Tide (liquid detergent) | -3.92 | Beer | -0.29 |
Coca-Cola | -1.22 | Catholic school attendance | -0.19 |
Grapes | -1.18 | Residential natural gas | -0.09 |
Restaurant meals | -0.67 | Gasoline | -0.06 |
Health insurance (low-income households) | -0.65 | Milk | -0.04 |
Sugar | -0.04 |
Additional info: The table demonstrates that goods with more substitutes (e.g., books at Barnes & Noble) have higher elasticities, while necessities (e.g., milk, gasoline) are highly inelastic.
