 Back
BackFirms in Perfectly Competitive Markets: Microeconomics Study Guide
Study Guide - Smart Notes
 Tailored notes based on your materials, expanded with key definitions, examples, and context.
Firms in Perfectly Competitive Markets
Market Structures
Microeconomics classifies markets based on the degree of competition among firms. The four main market structures are:
Perfect Competition: Many firms, identical products, no barriers to entry.
Monopolistic Competition: Many firms, differentiated products.
Oligopoly: Few firms, may sell identical or differentiated products.
Monopoly: One firm, unique product, high barriers to entry.
Each structure affects how firms interact with buyers and set prices.
Perfectly Competitive Markets
A perfectly competitive market is characterized by:
Many buyers and sellers
Identical products
No barriers to entry
Firms in such markets are price takers, meaning they cannot influence the market price. The demand curve for an individual firm is horizontal, reflecting that the firm can sell any quantity at the market price.

Profit Maximization in Perfect Competition
Firms aim to maximize profit, defined as total revenue minus total cost. In perfect competition:
Average Revenue (AR): Total revenue divided by quantity sold.
Marginal Revenue (MR): Change in total revenue from selling one more unit.
For perfectly competitive firms, P = AR = MR.
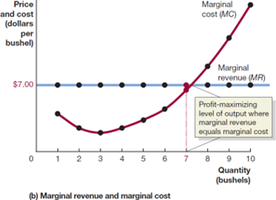
The profit-maximizing output is where MR = MC (marginal cost).
Rules for Profit Maximization:
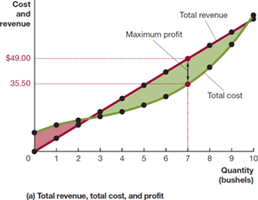
Produce where the difference between total revenue and total cost is greatest.
Produce where MR = MC.
For perfect competition, produce where P = MC.
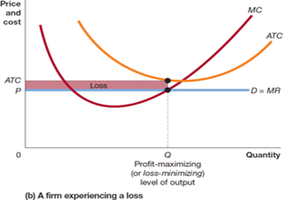
Illustrating Profit or Loss on the Cost Curve Graph
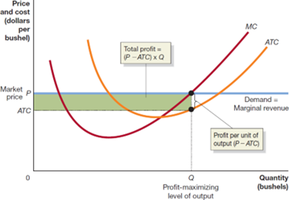
Profit can be visualized as the area between price and average total cost (ATC) at the profit-maximizing output:
Profit per unit:
Total profit:

Common error: Maximizing profit per unit (minimum ATC) does not necessarily maximize total profit.
Profit, Break-Even, and Loss
At the output where MC = MR:
If P > ATC, the firm makes a profit.
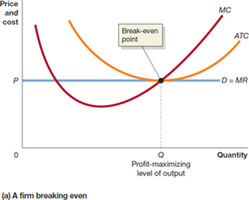
If P = ATC, the firm breaks even.
If P < ATC, the firm makes a loss.
Short-Run Production and Shutdown Decision
Firms may temporarily shut down if they are unable to cover their variable costs. Fixed costs are considered sunk and should not affect the shutdown decision.
If P < AVC (average variable cost), the firm should shut down and produce zero output.
If P > AVC, the firm should produce where MC = MR.
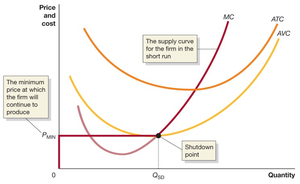
The marginal cost curve above AVC is the firm's supply curve in the short run.
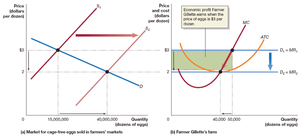
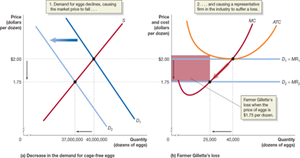
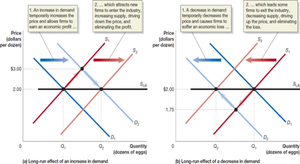
Entry and Exit in the Long Run
Economic profit attracts new firms, increasing supply and lowering price. Economic losses cause firms to exit, decreasing supply and raising price. In the long run, firms earn zero economic profit (break even).
Economic profit: Total revenue minus all costs, including implicit costs.
Entry and exit ensure price equals minimum ATC in the long run.

Long-Run Competitive Equilibrium
Long-run equilibrium occurs when entry and exit have resulted in the typical firm breaking even. The long-run supply curve is horizontal at the minimum point of the average cost curve.
Efficiency in Perfect Competition
Perfectly competitive markets achieve:
Productive efficiency: Goods are produced at the lowest possible cost.
Allocative efficiency: Goods are produced up to the point where the marginal benefit to consumers equals the marginal cost of production.
These efficiencies serve as benchmarks for evaluating other market structures.
Key Formulas
Profit:
Profit per unit:
Total profit:
Marginal Revenue:
Marginal Cost:
Summary Table: Firm Outcomes in Perfect Competition
Condition | Outcome |
|---|---|
P > ATC | Profit |
P = ATC | Break-even |
P < ATC | Loss |
P < AVC | Shutdown |
Additional info: These notes expand on textbook slides and examples, providing definitions, formulas, and context for exam preparation.
