 Back
BackFirms in Perfectly Competitive Markets: Structure, Profit Maximization, and Efficiency
Study Guide - Smart Notes
 Tailored notes based on your materials, expanded with key definitions, examples, and context.
Firms in Perfectly Competitive Markets
Introduction to Perfect Competition
Perfect competition is a foundational concept in microeconomics, describing a market structure where many firms sell identical products, and no single firm can influence the market price. This section explores the characteristics, profit maximization strategies, and efficiency outcomes of perfectly competitive markets.
Market Structures and Perfect Competition
Characteristics of Market Structures
Number of Firms: Refers to how many firms operate in the industry.
Type of Product: Whether products are identical or differentiated.
Ease of Entry: How easily new firms can enter the market.
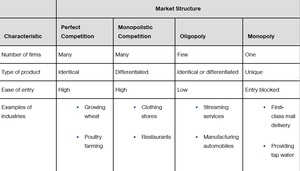
Perfect competition is characterized by many firms, identical products, and high ease of entry. Examples include wheat farming and poultry farming.
Characteristic | Perfect Competition | Monopolistic Competition | Oligopoly | Monopoly |
|---|---|---|---|---|
Number of firms | Many | Many | Few | One |
Type of product | Identical | Differentiated | Identical or differentiated | Unique |
Ease of entry | High | High | Low | Entry blocked |
Examples | Growing wheat, Poultry farming | Clothing stores, Restaurants | Streaming services, Manufacturing automobiles | First-class mail delivery, Providing tap water |
Perfectly Competitive Markets
Defining Features
Many buyers and sellers
Identical products
No barriers to entry
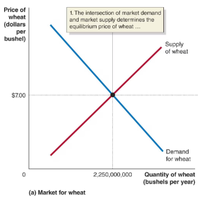
In such markets, firms are price takers—they must accept the market price determined by overall supply and demand.
Market and Firm Demand Curves
The market demand curve is downward sloping, reflecting the law of demand.
The individual firm’s demand curve is perfectly elastic (horizontal) at the market price, as the firm can sell any quantity at that price but none at a higher price.
Profit Maximization in Perfect Competition
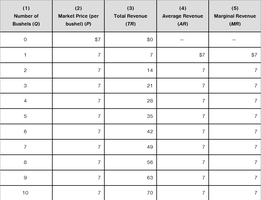
Revenue Concepts
Total Revenue (TR):
Average Revenue (AR):
Marginal Revenue (MR):
In perfect competition, .
Number of Bushels (Q) | Market Price (P) | Total Revenue (TR) | Average Revenue (AR) | Marginal Revenue (MR) |
|---|---|---|---|---|
0 | 7 | 0 | -- | -- |
1 | 7 | 7 | 7 | 7 |
2 | 7 | 14 | 7 | 7 |
3 | 7 | 21 | 7 | 7 |
4 | 7 | 28 | 7 | 7 |
5 | 7 | 35 | 7 | 7 |
6 | 7 | 42 | 7 | 7 |
7 | 7 | 49 | 7 | 7 |
8 | 7 | 56 | 7 | 7 |
9 | 7 | 63 | 7 | 7 |
10 | 7 | 70 | 7 | 7 |
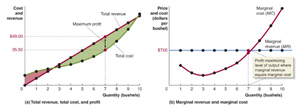
Profit Maximization Rule
Firms maximize profit where (marginal revenue equals marginal cost).
Profit is maximized at the output where the difference between total revenue and total cost is greatest.
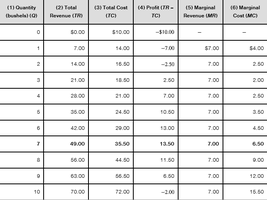
Quantity (Q) | Total Revenue (TR) | Total Cost (TC) | Profit (TR - TC) | Marginal Revenue (MR) | Marginal Cost (MC) |
|---|---|---|---|---|---|
0 | 0.00 | 10.00 | -10.00 | -- | -- |
1 | 7.00 | 14.00 | -7.00 | 7.00 | 4.00 |
2 | 14.00 | 16.00 | -2.00 | 7.00 | 2.00 |
3 | 21.00 | 18.50 | 2.50 | 7.00 | 2.50 |
4 | 28.00 | 21.00 | 7.00 | 7.00 | 2.50 |
5 | 35.00 | 24.00 | 11.00 | 7.00 | 3.00 |
6 | 42.00 | 28.50 | 13.50 | 7.00 | 4.50 |
7 | 49.00 | 35.50 | 13.50 | 7.00 | 7.00 |
8 | 56.00 | 44.50 | 11.50 | 7.00 | 9.00 |
9 | 63.00 | 55.00 | 8.00 | 7.00 | 10.50 |
10 | 70.00 | 72.00 | -2.00 | 7.00 | 15.50 |
Graphical Analysis of Profit Maximization
Profit is maximized where the vertical distance between total revenue and total cost is greatest.
Alternatively, profit is maximized where .
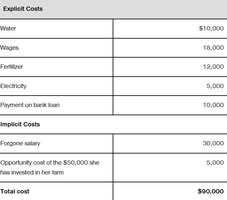
Profit, Loss, and the Cost Curve
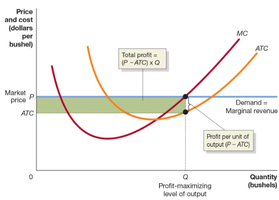
Profit and Average Total Cost
Profit per unit:
Total profit:
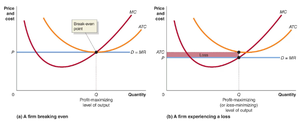
Break-Even and Loss Situations
If , the firm earns a profit.
If , the firm breaks even (zero economic profit).
If , the firm incurs a loss.
Short-Run Decisions: Produce or Shut Down?
Shut Down Rule
A firm should continue to produce as long as total revenue covers variable costs, even if it incurs a loss.
If price falls below average variable cost (AVC), the firm should shut down in the short run.
Fixed costs are sunk in the short run and should not affect the shutdown decision.
Short-Run Supply Curve
The firm’s marginal cost curve above the minimum AVC is its short-run supply curve.
Long-Run Entry and Exit of Firms
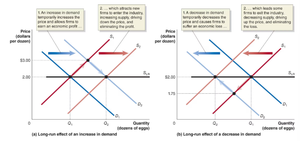
Economic Profit and Entry
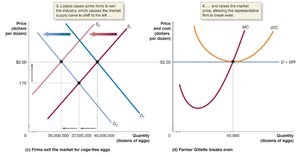
Economic profit attracts new firms, shifting the market supply curve right and lowering price until firms break even.
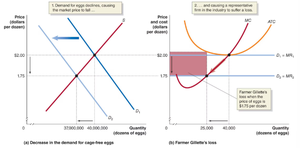
Economic Loss and Exit
Economic losses cause firms to exit, shifting the market supply curve left and raising price until remaining firms break even.
Long-Run Competitive Equilibrium
In the long run, entry and exit result in zero economic profit for typical firms.
The market price equals the minimum point on the long-run average cost curve.
Long-Run Supply Curve
Shows the relationship between market price and quantity supplied in the long run.
In a constant-cost industry, the long-run supply curve is horizontal at the break-even price.
Economic Efficiency in Perfect Competition
Productive Efficiency
Goods are produced at the lowest possible cost (minimum ATC).
Competition ensures only the most efficient firms survive in the long run.
Allocative Efficiency
Firms produce up to the point where .
This ensures resources are allocated to produce the goods most valued by consumers.
In summary, perfectly competitive markets lead to both productive and allocative efficiency, maximizing societal welfare without the need for centralized control.
