 Back
BackGovernment Intervention: Price Controls and Taxes in Microeconomics
Study Guide - Smart Notes
 Tailored notes based on your materials, expanded with key definitions, examples, and context.
Government Intervention in Markets
Price Floors and Price Ceilings
Governments often intervene in markets by imposing price controls, which can take the form of price floors or price ceilings. These interventions are designed to influence the prices at which goods and services are traded, but they can have significant effects on market outcomes.
Price Ceiling: A legally determined maximum price that sellers may charge for a good or service.
Price Floor: A legally determined minimum price that sellers may receive for a good or service.
Binding Price Controls: A price ceiling is binding when the market price is above the ceiling; a price floor is binding when the market price is below the floor.
The Economic Effect of a Price Floor
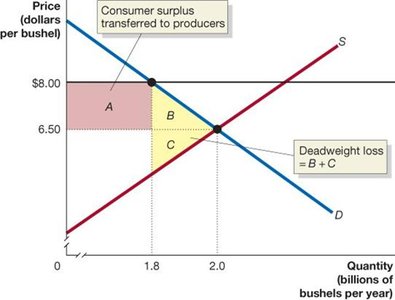
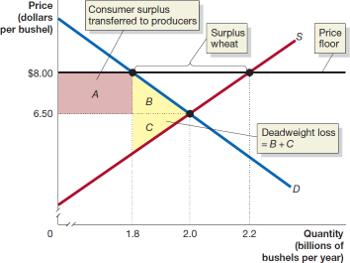
Price floors, such as those imposed in agricultural markets, can lead to surpluses and deadweight loss. For example, a price floor in the wheat market above equilibrium price reduces the quantity traded and transfers consumer surplus to producers.
Surplus: When the price floor is set above equilibrium, producers supply more than consumers demand, resulting in excess supply.
Deadweight Loss: The reduction in economic surplus due to inefficient allocation of resources.
Consumer Surplus Transferred: Some consumer surplus is transferred to producers due to the higher price.
Example: If the equilibrium price of wheat is $6.50 per bushel and a price floor of $8.00 is imposed, the quantity traded falls, and a surplus develops.
The Economic Effect of a Price Ceiling
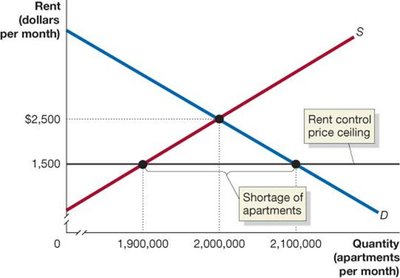
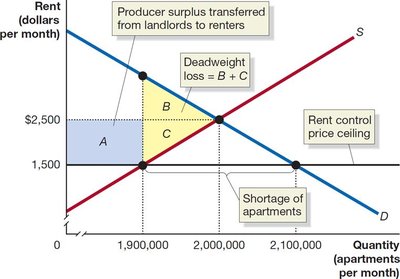
Price ceilings, such as rent control, can lead to shortages and deadweight loss. When the ceiling is set below equilibrium, the quantity supplied falls and the quantity demanded rises, resulting in a shortage.
Shortage: The difference between the quantity demanded and quantity supplied at the ceiling price.
Producer Surplus Transferred: Some producer surplus is transferred to consumers.
Deadweight Loss: The loss of economic surplus from apartments that are no longer rented.
Example: If the equilibrium rent is $2,500 and a ceiling of $1,500 is imposed, fewer apartments are supplied, more are demanded, and a shortage results.
Black Markets and Peer-to-Peer Sites
Shortages caused by price ceilings may lead to black markets, where goods are traded illegally at prices above the ceiling. Peer-to-peer rental sites can also circumvent rent controls, but participants lose legal protections.
Results of Government Price Controls
Some individuals benefit (e.g., renters under rent control, producers under price floors).
Others are worse off (e.g., landlords, consumers facing higher prices).
The economy generally suffers due to deadweight loss.
Positive and Normative Analysis
Economic analysis shows that price controls decrease efficiency, but whether they are 'bad' is a normative question, depending on societal values and judgments.
The Economic Effect of Taxes
Per-Unit Taxes
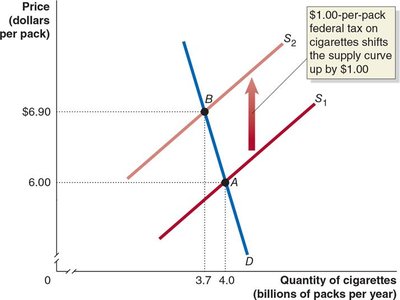
Governments use taxes to fund activities, often imposing per-unit taxes (a fixed dollar amount per unit sold). These taxes shift the supply curve upward by the amount of the tax, increasing prices and reducing quantity traded.
Marginal Cost Increase: The tax increases firms' marginal costs, requiring higher prices to supply the same quantity.
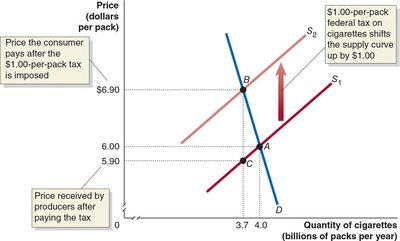
New Equilibrium: The equilibrium price rises, quantity falls, and the division of tax burden is determined by market forces.
Example: A $1.00-per-pack tax on cigarettes shifts the supply curve up, increasing the price paid by consumers and reducing quantity sold.

Tax Revenue and Deadweight Loss
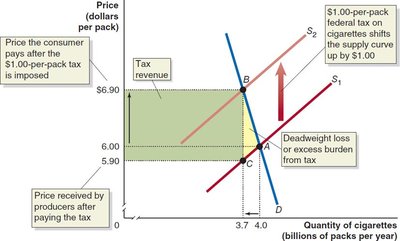
Tax Revenue: The government collects revenue equal to the tax per unit times the quantity sold after the tax.
Deadweight Loss: Some consumer and producer surplus is lost due to reduced quantity traded.
Excess Burden: The deadweight loss from a tax is called its excess burden; efficient taxes minimize this relative to revenue raised.
Tax Incidence: Who Pays the Tax?
Tax incidence refers to the actual division of the tax burden between buyers and sellers. It is determined by the relative elasticities (slopes) of demand and supply, not by legal assignment.
If demand is steep (inelastic), buyers bear more of the tax burden.
If demand is flat (elastic), sellers bear more of the tax burden.
Legal obligation to pay does not affect the economic incidence.
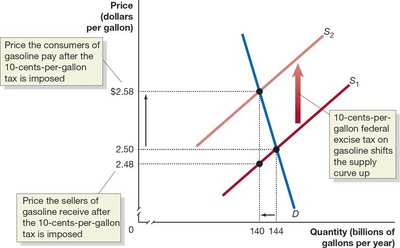
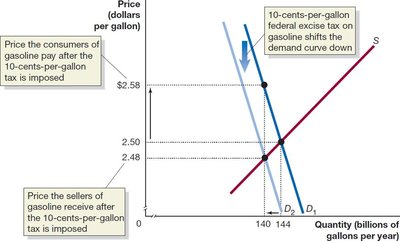
Example: Tax Incidence in Gasoline Market
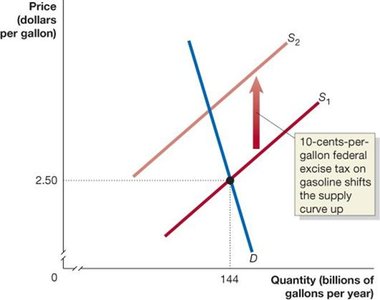
A 10-cent-per-gallon excise tax on gasoline shifts the supply curve up, increasing the price paid by consumers and decreasing the price received by sellers. The division of the tax burden depends on the relative elasticities.
What Determines Tax Incidence?
Elasticity of Demand: Steep demand curves mean buyers bear more of the tax; flat curves mean sellers bear more.
Elasticity of Supply: Similar logic applies; steep supply curves mean sellers bear more of the tax.
Quantitative Demand and Supply Analysis
Example Calculation: Tax on Coca-Cola Bottles
Given supply and demand equations for 2L Coca-Cola bottles:
Demand:
Supply:
If a $2 per-unit tax is imposed, students are asked to calculate producer surplus, deadweight loss, and the change in producer surplus. This involves shifting the supply curve, finding new equilibrium, and computing areas under the curves.
Additional info: To solve, set up the new supply equation with the tax, find the new equilibrium, and use the formulas for producer surplus and deadweight loss.
Producer Surplus: Area above supply curve and below price received by producers.
Deadweight Loss: Area representing lost surplus due to reduced quantity traded.
----------------------------------------
