 Back
BackGovernment Intervention: Taxes, Subsidies, and Price Regulation in Microeconomics
Study Guide - Smart Notes
 Tailored notes based on your materials, expanded with key definitions, examples, and context.
Government Intervention in Markets
Introduction to Government Intervention
Government intervention in markets is a central topic in microeconomics, focusing on how taxes, subsidies, and price controls affect market outcomes. These policies are used to raise revenue, redistribute income, correct market failures, and regulate prices to achieve social objectives.
Taxes and Subsidies
Purposes of Taxes and Subsidies
Raise Revenue: To fund public goods and government operations.
Redistribute Income: To reduce economic inequality.
Correct Market Failures: Such as externalities (e.g., pollution).
Influence Behavior: Discourage or encourage consumption/production of certain goods.
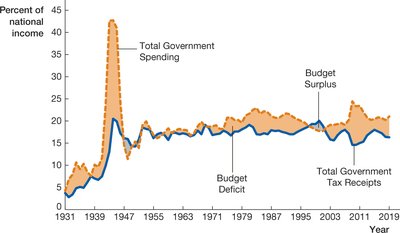
Government Budget Deficit and Surplus
Budget Deficit: Occurs when government spending exceeds tax revenue.
Budget Surplus: Occurs when tax revenue exceeds government spending.
Sources and Uses of Tax Revenue
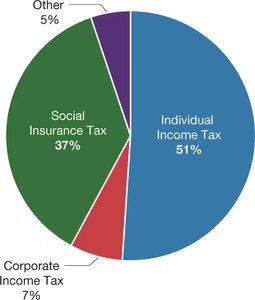
Federal Tax Revenues: Primarily from individual income taxes, social insurance taxes, and corporate income taxes.
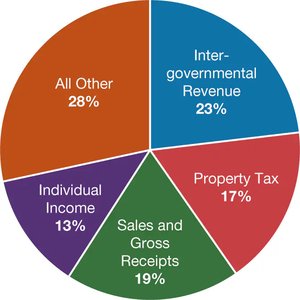
State Tax Revenues: Include intergovernmental revenue, property tax, sales and gross receipts, and individual income tax.
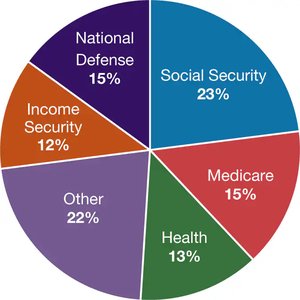
Federal Tax Use: Major expenditures include Social Security, Medicare, health, national defense, and income security.
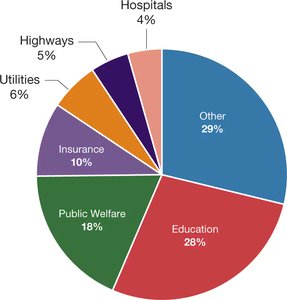
State Tax Use: Major expenditures include education, public welfare, insurance, utilities, highways, and hospitals.
Types of Taxes
Individual Income Taxes: Tax on personal income. Can be progressive, proportional, or regressive.
Payroll Taxes: Taxes on wages, often funding social insurance programs.
Excise Taxes: Per-unit taxes on specific goods (e.g., alcohol, tobacco).
Sales Taxes: Ad valorem taxes, paid as a percentage of the sale price.
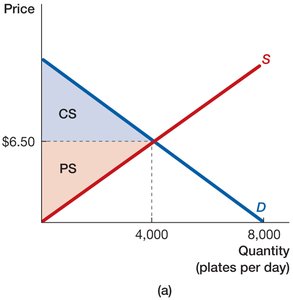
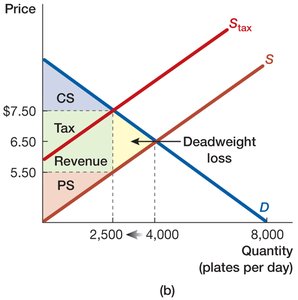
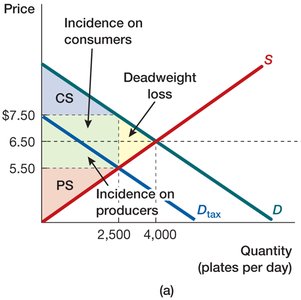
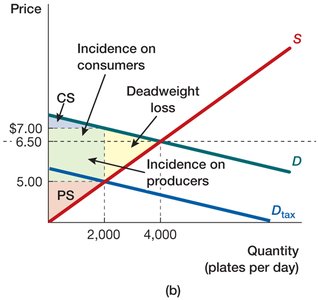
Per-Unit Tax
A per-unit tax is a fixed amount imposed on each unit sold, either on producers or consumers. It shifts the supply or demand curve, affecting equilibrium price and quantity.
Imposed on Producers: Shifts supply curve upward by the tax amount.
Imposed on Consumers: Shifts demand curve downward by the tax amount.
Tax Revenue: Area representing government revenue from the tax.
Deadweight Loss (DWL): The reduction in total surplus due to the tax, calculated as:
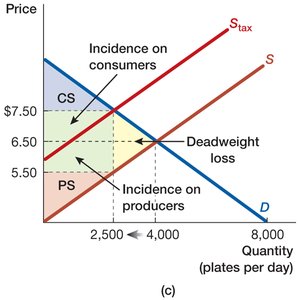
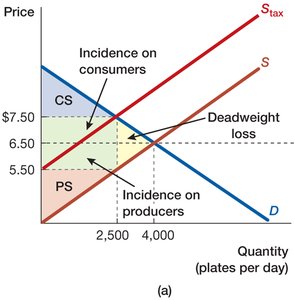
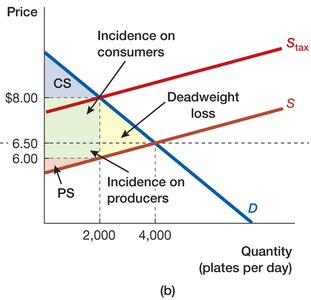
Tax Incidence
Tax incidence describes how the burden of a tax is shared between consumers and producers, regardless of who is legally responsible for paying the tax. The division depends on the relative elasticities of supply and demand.
More Inelastic Side: Bears a greater share of the tax burden.
More Elastic Side: Bears a smaller share of the tax burden.
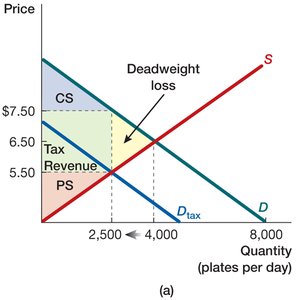
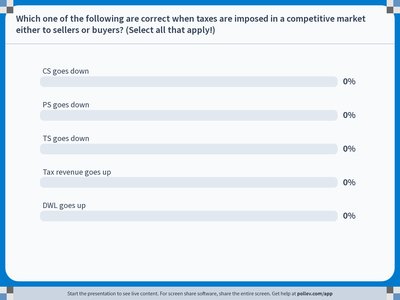
Summary of Per-Unit Tax Effects
Consumer Surplus (CS) decreases
Producer Surplus (PS) decreases
Total Surplus (TS) decreases
Tax Revenue increases (to the government)
Deadweight Loss (DWL) increases
Elasticity and Tax Incidence
The more inelastic the demand or supply, the greater the tax burden on that side of the market. If supply is more elastic, consumers bear more of the tax; if demand is more elastic, producers bear more.
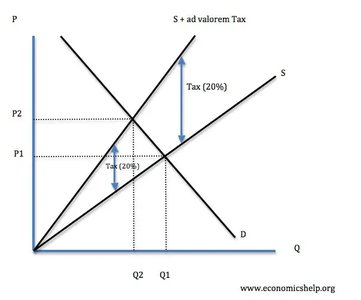
Ad Valorem Tax
An ad valorem tax is a percentage of the sale price, causing the supply curve to rotate rather than shift in parallel. The higher the price, the greater the tax paid per unit.
Subsidies
A subsidy is a negative tax, given to producers or consumers to encourage production or consumption. It increases consumer and producer surplus but creates a deadweight loss due to overproduction and reduces government revenue.
Incidence of Subsidy: The less elastic side of the market benefits more from a subsidy.
Price Regulation
Price Ceilings and Price Floors
Price regulation occurs when the government sets legal limits on prices. A price ceiling is a maximum price, while a price floor is a minimum price.
Price Ceiling: Must be set below equilibrium to be effective; causes excess demand (shortage).
Price Floor: Must be set above equilibrium to be effective; causes excess supply (surplus).
Examples: Rent control (ceiling), minimum wage (floor).
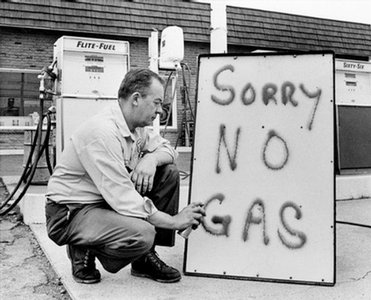
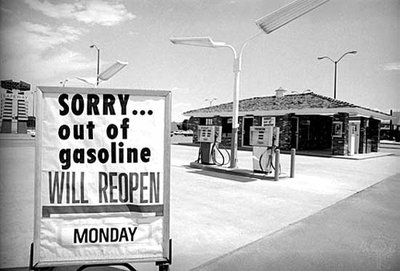
Case Study: Gasoline Price Ceilings
During the 1973-74 oil crisis, the U.S. government imposed price ceilings on gasoline, leading to shortages and long lines at gas stations. Non-price rationing mechanisms, such as waiting time or favoritism, determined who received gas.
Graphical Analysis of Price Ceilings
Price ceilings below equilibrium create excess demand, reduce producer surplus, and may increase or decrease consumer surplus depending on allocation. Deadweight loss results from underproduction.
Price Regulation | Price Ceiling | Price Floor |
|---|---|---|
Effective When | Below equilibrium price | Above equilibrium price |
Market Outcome | Excess demand (shortage) | Excess supply (surplus) |
Production Level | Underproduction | Overproduction |
Consumer Surplus | May increase or decrease | Decreases |
Producer Surplus | Decreases | May increase or decrease |
Deadweight Loss | Yes | Yes |
Summary
Government intervention through taxes, subsidies, and price controls alters market outcomes, often creating deadweight loss.
Tax and subsidy incidence depends on elasticity; the less elastic side bears more burden or receives more benefit.
Price ceilings and floors disrupt equilibrium, causing shortages or surpluses and reducing total welfare.
