 Back
BackMicroeconomics Cost Concepts and Production Analysis Study Guide
Study Guide - Smart Notes
 Tailored notes based on your materials, expanded with key definitions, examples, and context.
Q1. Which costs are considered variable for Jan's lemonade stand?
Background
Topic: Cost Classification in Production
This question tests your understanding of the difference between variable and fixed costs in a business setting.
Key Terms:
Variable Costs: Costs that change with the level of output (e.g., ingredients, hourly wages).
Fixed Costs: Costs that do not change with output (e.g., rent, equipment purchase).
Step-by-Step Guidance
Identify which costs change as Jan produces more lemonade (e.g., more lemons and sugar are needed for more sales).
Consider whether building the stand or hiring an artist are one-time or recurring costs.
Compare each option to the definition of variable costs.
Try solving on your own before revealing the answer!
Q2. What is the marginal product of the third worker according to Table 13-5?
Background
Topic: Marginal Product of Labor
This question tests your ability to calculate the marginal product, which is the additional output from hiring one more worker.
Key Formula:
Step-by-Step Guidance
Find the output with two workers and with three workers from the table.
Calculate the difference in output between these two levels.
Interpret this difference as the marginal product of the third worker.
Try solving on your own before revealing the answer!
Q3. When does diminishing marginal product begin according to Table 13-5?
Background
Topic: Law of Diminishing Marginal Returns
This question tests your understanding of when additional workers start to contribute less to total output.
Key Concept:
Diminishing marginal product occurs when each additional worker adds less to output than the previous worker.
Step-by-Step Guidance
Calculate the marginal product for each worker using the table.
Compare the marginal products to see where the decrease begins.
Identify the worker after which the marginal product starts to decline.
Try solving on your own before revealing the answer!
Q4. Which of the following is an implicit cost of production?
Background
Topic: Explicit vs. Implicit Costs
This question tests your ability to distinguish between costs that involve direct payment and those that represent opportunity costs.
Key Terms:
Explicit Costs: Direct, out-of-pocket payments (e.g., wages, bills).
Implicit Costs: Opportunity costs of using resources owned by the firm (e.g., foregone rent).
Step-by-Step Guidance
Review each option and determine if it involves a direct payment or an opportunity cost.
Identify which option represents a cost for resources the firm owns and could have used elsewhere.
Try solving on your own before revealing the answer!
Q5. What is the variable cost of producing 5 units of output according to Table 13-14?
Background
Topic: Cost Tables and Variable Cost Calculation
This question tests your ability to read a cost table and identify variable costs at a specific output level.
Key Formula:
Step-by-Step Guidance
Locate the row for 5 units of output in the table.
Identify the variable cost value listed for that output.
Try solving on your own before revealing the answer!
Q6. What is the fixed cost of production for this firm according to Table 13-14?
Background
Topic: Fixed Cost Identification
This question tests your ability to identify fixed costs from a cost table.
Key Formula:
Step-by-Step Guidance
Look for the fixed cost value in the table, which should remain constant across different output levels.
Identify the fixed cost for the lowest output level.
Try solving on your own before revealing the answer!
Q7. What is the marginal cost of the 8th unit of output according to Table 13-14?
Background
Topic: Marginal Cost Calculation
This question tests your ability to calculate the cost of producing one additional unit.
Key Formula:
Step-by-Step Guidance
Find the total cost for 7 and 8 units of output in the table.
Calculate the difference in total cost between these two levels.
Divide this difference by the change in quantity (usually 1 unit).
Try solving on your own before revealing the answer!
Q8. What is the average variable cost of producing 6 units of output according to Table 13-14?
Background
Topic: Average Variable Cost Calculation
This question tests your ability to calculate average variable cost from a cost table.
Key Formula:
Step-by-Step Guidance
Find the variable cost for 6 units of output in the table.
Divide the variable cost by the number of units produced (6).
Try solving on your own before revealing the answer!
Q9. In the short run, if marginal product is at its maximum, what happens to costs?
Background
Topic: Marginal Product and Cost Relationships
This question tests your understanding of how marginal product relates to cost curves.
Key Concept:
When marginal product is at its maximum, marginal cost is at its minimum.
Step-by-Step Guidance
Recall the relationship between marginal product and marginal cost: as marginal product increases, marginal cost decreases.
Identify what happens to average and total costs when marginal product is maximized.
Try solving on your own before revealing the answer!
Q10. What happens when marginal cost is less than average total cost?
Background
Topic: Cost Curve Dynamics
This question tests your understanding of how marginal cost affects average total cost.
Key Concept:
If marginal cost is below average total cost, average total cost is falling.
Step-by-Step Guidance
Compare marginal cost and average total cost values.
Recall the rule: when MC < ATC, ATC decreases.
Try solving on your own before revealing the answer!
Q11. According to Figure 13-9, at which output levels does the firm experience economies of scale?
Background
Topic: Economies of Scale and Cost Curves
This question tests your ability to interpret cost curves and identify where average total cost decreases as output increases.
Key Terms:
Economies of Scale: When increasing production lowers average total cost.
Average Total Cost (ATC): Total cost divided by quantity produced.
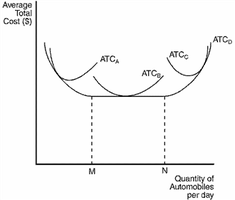
Step-by-Step Guidance
Examine the graph and identify the range where the ATC curve slopes downward as output increases.
Locate the points labeled M and N, and determine which output levels correspond to economies of scale.
Consider the definition: economies of scale occur where ATC decreases as quantity increases.
Try solving on your own before revealing the answer!
