 Back
BackMicroeconomics: Demand, Supply, and Market Equilibrium
Study Guide - Smart Notes
 Tailored notes based on your materials, expanded with key definitions, examples, and context.
Demand and Supply: Foundations of Market Economics
Introduction to Markets and Prices
Markets are arrangements that enable buyers and sellers to exchange information and conduct business. In a competitive market, many buyers and sellers interact such that no single participant can influence the price. The money price is the amount of money required to purchase a good, while the relative price (the ratio of the money price of one good to another) represents the opportunity cost of choosing one good over another.
Demand
Definition and Law of Demand
To demand a good, a consumer must want it, be able to afford it, and have a definite plan to buy it. The quantity demanded is the amount consumers plan to buy at a specific price over a given period.
Law of Demand: Other things being equal, as the price of a good rises, the quantity demanded falls; as the price falls, the quantity demanded rises.
Two key effects explain this law:
Substitution Effect: As the price of a good rises, consumers switch to substitutes, reducing quantity demanded.
Income Effect: A higher price reduces consumers' purchasing power, decreasing quantity demanded.
Demand Curve and Demand Schedule
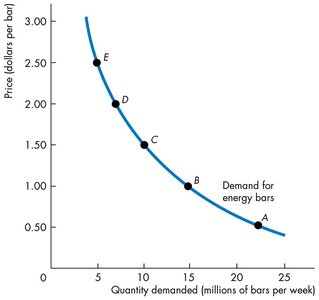
The demand curve shows the relationship between the price of a good and the quantity demanded, holding other factors constant. It is also a willingness-and-ability-to-pay curve, reflecting the marginal benefit consumers receive from each additional unit.
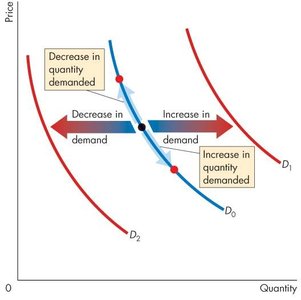
Movements Along and Shifts of the Demand Curve
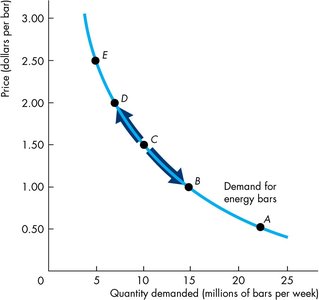
Movement along the demand curve: Caused by a change in the price of the good itself, leading to a change in quantity demanded.
Shift of the demand curve: Occurs when a non-price factor changes, altering demand at every price.
Factors That Shift Demand
Prices of related goods: Substitutes (goods used in place of each other) and complements (goods used together).
Expected future prices: If prices are expected to rise, current demand increases.
Income: Higher income increases demand for normal goods and decreases demand for inferior goods.
Taxes and subsidies
Expected future income and credit
Population: Larger population increases demand.
Preferences: Changes in tastes and preferences affect demand.
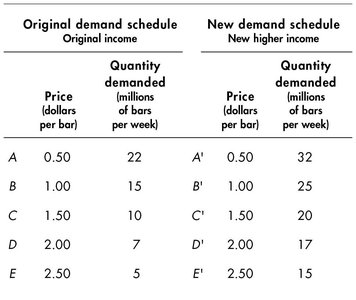
Example: Demand Schedule and Curve Shift
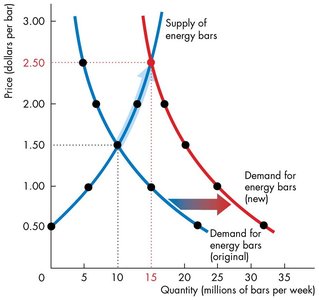
When income increases, the demand for energy bars rises at every price, shifting the demand curve rightward.
Original demand schedule Original income | New demand schedule New higher income | ||
|---|---|---|---|
Price (dollars per bar) | Quantity demanded (millions of bars per week) | Price (dollars per bar) | Quantity demanded (millions of bars per week) |
0.50 | 22 | 0.50 | 32 |
1.00 | 15 | 1.00 | 25 |
1.50 | 10 | 1.50 | 20 |
2.00 | 7 | 2.00 | 17 |
2.50 | 5 | 2.50 | 15 |
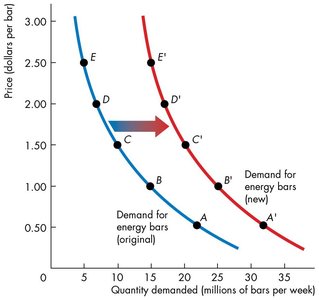
Distinguishing Change in Demand vs. Change in Quantity Demanded
A change in quantity demanded is a movement along the demand curve due to a price change. A change in demand is a shift of the entire demand curve due to a change in a non-price determinant.
Supply
Definition and Law of Supply
To supply a good, a firm must have the resources and technology to produce it, expect to profit, and have a plan to sell it. The quantity supplied is the amount producers plan to sell at a specific price over a given period.
Law of Supply: Other things being equal, as the price of a good rises, the quantity supplied rises; as the price falls, the quantity supplied falls.
This law is due to increasing marginal cost as output increases; producers supply more only if the price covers the higher marginal cost.
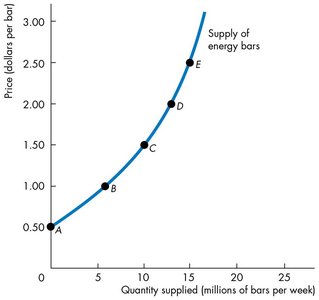
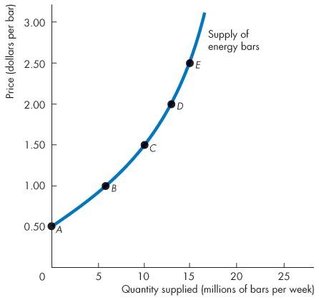
Supply Curve and Supply Schedule
The supply curve shows the relationship between the price of a good and the quantity supplied, holding other factors constant. It is also a minimum-supply-price curve, reflecting the marginal cost of production.
Factors That Shift Supply
Prices of factors of production: Higher input costs decrease supply.
Prices of related goods produced: Substitutes in production and complements in production affect supply.
Expected future prices: If prices are expected to rise, current supply decreases.
Taxes and subsidies
Number of suppliers: More suppliers increase supply.
Technology: Advances increase supply.
State of nature: Natural events can increase or decrease supply.
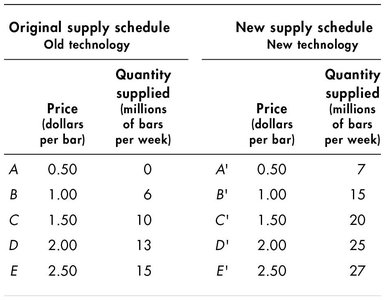
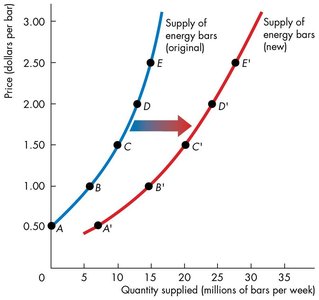
Example: Supply Schedule and Curve Shift
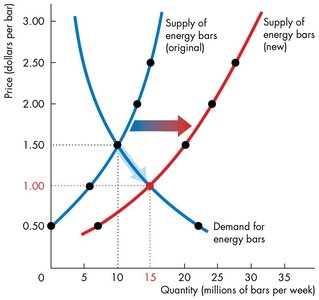
Technological advances increase the supply of energy bars at every price, shifting the supply curve rightward.
Original supply schedule Old technology | New supply schedule New technology | ||
|---|---|---|---|
Price (dollars per bar) | Quantity supplied (millions of bars per week) | Price (dollars per bar) | Quantity supplied (millions of bars per week) |
0.50 | 0 | 0.50 | 7 |
1.00 | 6 | 1.00 | 15 |
1.50 | 10 | 1.50 | 20 |
2.00 | 13 | 2.00 | 25 |
2.50 | 15 | 2.50 | 27 |
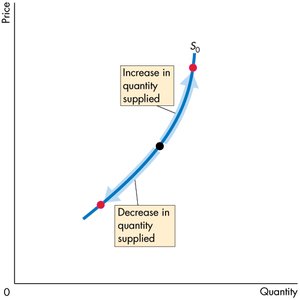
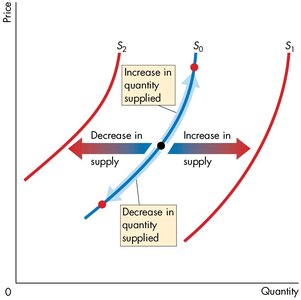
Distinguishing Change in Supply vs. Change in Quantity Supplied
A change in quantity supplied is a movement along the supply curve due to a price change. A change in supply is a shift of the entire supply curve due to a change in a non-price determinant.
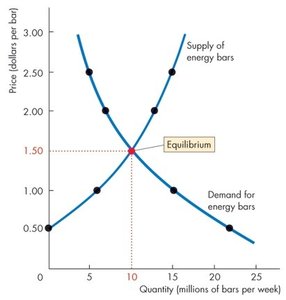
Market Equilibrium
Definition and Determination
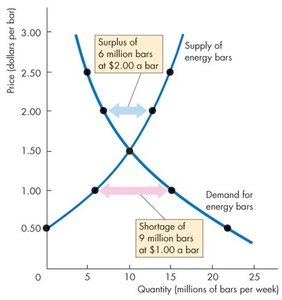
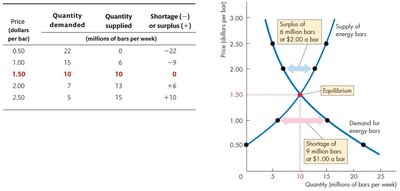
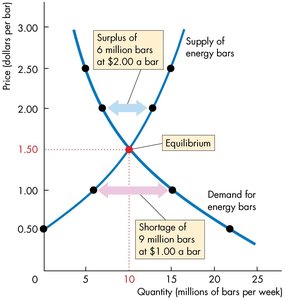
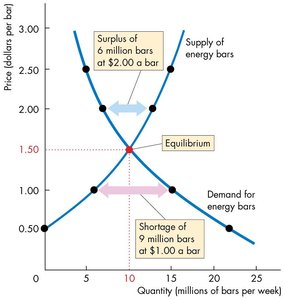
Market equilibrium occurs when the quantity demanded equals the quantity supplied at a particular price, known as the equilibrium price. The equilibrium quantity is the amount bought and sold at this price. Price acts as a regulator, adjusting to balance buyers' and sellers' plans.
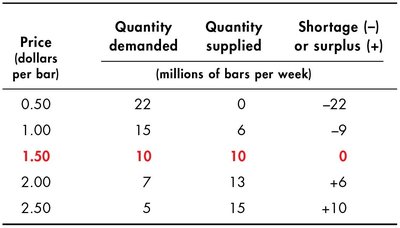
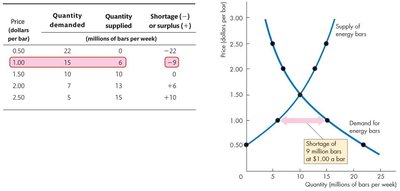
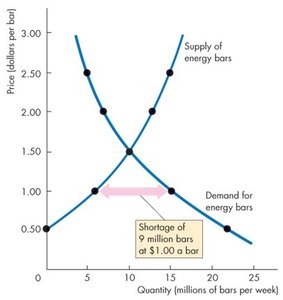
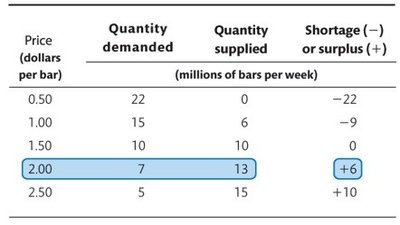
Shortages and Surpluses
Shortage: If the price is below equilibrium, quantity demanded exceeds quantity supplied, creating upward pressure on price.
Surplus: If the price is above equilibrium, quantity supplied exceeds quantity demanded, creating downward pressure on price.
Comparative Statics: Predicting Changes in Price and Quantity
Effects of Changes in Demand and Supply
Increase in demand: Raises both equilibrium price and quantity.
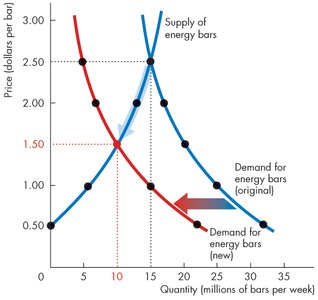
Decrease in demand: Lowers both equilibrium price and quantity.
Increase in supply: Lowers equilibrium price but raises equilibrium quantity.
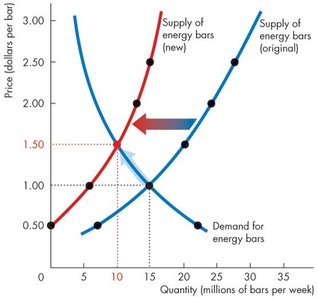
Decrease in supply: Raises equilibrium price but lowers equilibrium quantity.
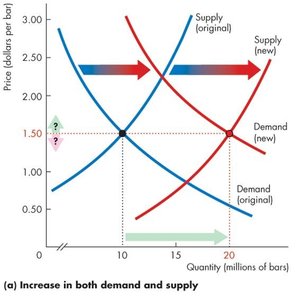
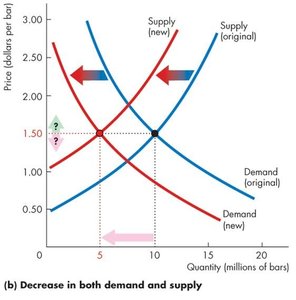
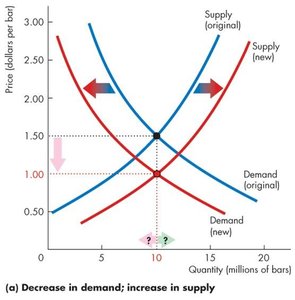
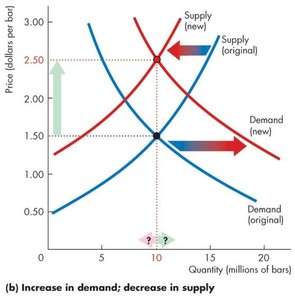
Simultaneous Changes in Demand and Supply
Both increase: Equilibrium quantity rises; price change is uncertain.
Both decrease: Equilibrium quantity falls; price change is uncertain.
Demand increases, supply decreases: Price rises; quantity change is uncertain.
Demand decreases, supply increases: Price falls; quantity change is uncertain.
Summary and Key Takeaways
Understand the underlying principles of demand and supply.
Identify the factors that shift demand and supply curves.
Distinguish between changes in quantity demanded/supplied and changes in demand/supply.
Recognize and calculate market equilibrium price and quantity.
Predict the effects of changes in demand and/or supply on market outcomes.
