 Back
BackMicroeconomics Exam 1 Study Notes
Study Guide - Smart Notes
 Tailored notes based on your materials, expanded with key definitions, examples, and context.
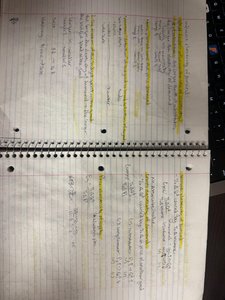
Module 1: Introduction to Economics
What is Economics?
Economics is the study of how individuals and societies allocate scarce resources to satisfy unlimited wants. It involves understanding the choices people make, the incentives that influence those choices, and the consequences of those decisions.
Scarcity: The fundamental economic problem of having seemingly unlimited human wants in a world of limited resources.
Incentive: A reward or penalty that motivates behavior.
Economics as a Social Science: Uses scientific methods to build theories that can help explain the behavior of individuals, groups, and organizations.
Microeconomics vs. Macroeconomics: Microeconomics focuses on individual markets and the behavior of consumers and firms, while macroeconomics looks at the economy as a whole.
Factors of Production: Land, labor, capital, and entrepreneurship are the resources used to produce goods and services.
Example: Deciding how to spend your time between studying and working is an economic choice involving opportunity cost.
Opportunity Cost
Opportunity cost is the value of the next best alternative foregone when a choice is made. It is a key concept for understanding trade-offs in economics.
Definition: The cost of the next best alternative use of resources.
Application: If you spend time studying instead of working, the opportunity cost is the wage you could have earned.
Formula:
Module 2: The Economic Problem
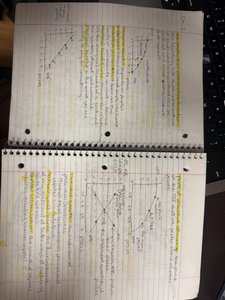
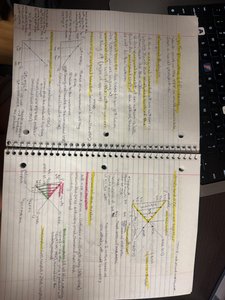
Production Possibilities Frontier (PPF)
The Production Possibilities Frontier (PPF) is a curve that shows the maximum attainable combinations of two products that may be produced with available resources and current technology.
Efficient Production: Points on the PPF represent efficient use of resources.
Inefficient Production: Points inside the PPF indicate underutilization of resources.
Unattainable Production: Points outside the PPF are not possible given current resources.
Law of Increasing Opportunity Cost: As production of one good increases, the opportunity cost of producing an additional unit rises.
Example: A country can produce either computers or cars. The PPF shows the trade-off between the two goods.
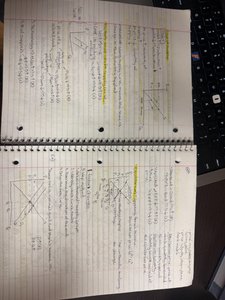
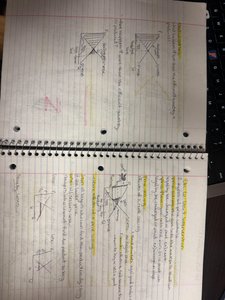
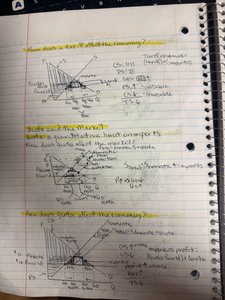
Economic Growth
Economic growth is represented by an outward shift of the PPF, indicating an increase in the capacity to produce goods and services.
Sources of Growth: Increases in resources, improvements in technology.
Impact: Allows for higher production of both goods.
Formula:
Module 3: Demand and Supply
Demand
Demand refers to the quantity of a good or service that consumers are willing and able to purchase at various prices during a given period of time.
Law of Demand: As the price of a good falls, the quantity demanded rises, ceteris paribus.
Demand Curve: A graphical representation showing the inverse relationship between price and quantity demanded.
Determinants of Demand: Income, tastes, prices of related goods, expectations, number of buyers.
Supply
Supply is the quantity of a good or service that producers are willing and able to sell at various prices over a period of time.
Law of Supply: As the price of a good rises, the quantity supplied increases, ceteris paribus.
Supply Curve: A graphical representation showing the direct relationship between price and quantity supplied.
Determinants of Supply: Input prices, technology, expectations, number of sellers, taxes and subsidies.
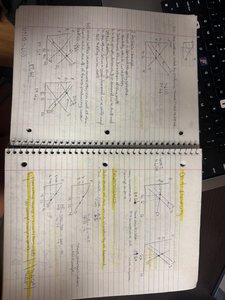
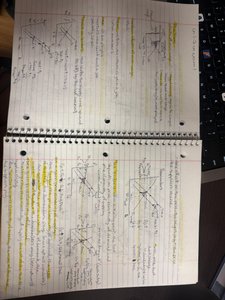
Market Equilibrium
Market equilibrium occurs where the quantity demanded equals the quantity supplied at a particular price. This price is known as the equilibrium price, and the quantity is the equilibrium quantity.
Surplus: Occurs when quantity supplied exceeds quantity demanded at a given price.
Shortage: Occurs when quantity demanded exceeds quantity supplied at a given price.
Module 4: Elasticity
Price Elasticity of Demand
Price elasticity of demand measures the responsiveness of quantity demanded to a change in price.
Elastic Demand: Quantity demanded changes significantly as price changes (elasticity > 1).
Inelastic Demand: Quantity demanded changes little as price changes (elasticity < 1).
Unit Elastic: Percentage change in quantity demanded equals percentage change in price (elasticity = 1).
Formula:
Total Revenue and Elasticity
Total revenue is the total amount of money received by sellers of a good, calculated as price times quantity sold. The relationship between total revenue and elasticity helps firms decide on pricing strategies.
If demand is elastic: Lowering price increases total revenue.
If demand is inelastic: Raising price increases total revenue.
Module 5: Efficiency and Equity
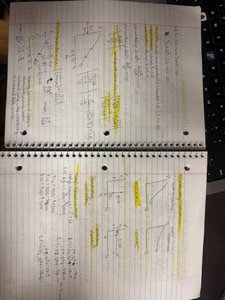
Consumer and Producer Surplus
Consumer surplus is the difference between what consumers are willing to pay and what they actually pay. Producer surplus is the difference between the price producers receive and the minimum they are willing to accept.
Consumer Surplus: Area below the demand curve and above the price line.
Producer Surplus: Area above the supply curve and below the price line.
Market Efficiency
A market is efficient when the sum of consumer and producer surplus is maximized. Deadweight loss occurs when market outcomes are not efficient, often due to price controls or taxes.
Deadweight Loss: The reduction in total surplus that results from a market distortion.
Module 6: Government Actions in Markets
Price Ceilings and Price Floors
Government-imposed price controls can lead to shortages or surpluses in the market.
Price Ceiling: A legal maximum on the price of a good (e.g., rent control).
Price Floor: A legal minimum on the price of a good (e.g., minimum wage).
Effects: Price ceilings can cause shortages; price floors can cause surpluses.
Taxes and Subsidies
Taxes and subsidies affect market outcomes by shifting supply or demand curves, changing equilibrium price and quantity, and creating deadweight loss.
Tax Incidence: The division of the burden of a tax between buyers and sellers.
Subsidy: A payment made by the government to encourage or support a particular economic activity.

Module 7: Global Markets in Action
International Trade
International trade allows countries to specialize in the production of goods for which they have a comparative advantage, increasing overall economic welfare.
Comparative Advantage: The ability to produce a good at a lower opportunity cost than another producer.
Gains from Trade: Both trading partners can benefit from specialization and exchange.
Additional info:
Some diagrams and graphs were inferred to match standard textbook representations based on the handwritten notes and highlighted terms.
All formulas are presented in LaTeX format for clarity and academic rigor.
