 Back
BackMicroeconomics Exam 4 Review: International Trade and Production Costs
Study Guide - Smart Notes
 Tailored notes based on your materials, expanded with key definitions, examples, and context.
Q1. Economic Surplus with No Trade (Autarky)
Background
Topic: Economic Surplus in Closed Economies (Autarky)
This question is about understanding how consumer and producer surplus are determined in a market where no international trade is allowed (autarky). It focuses on the equilibrium price and quantity, and how surplus is distributed between consumers and producers.
Key Terms and Formulas:
Consumer Surplus: The area above the equilibrium price and below the demand curve.
Producer Surplus: The area below the equilibrium price and above the supply curve.
Autarky: A situation where a country does not trade with other countries.
Step-by-Step Guidance
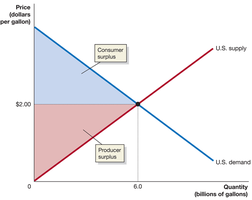
Identify the equilibrium price and quantity where the domestic supply and demand curves intersect. In this case, it is at $2.00 per gallon and 6.0 billion gallons.
Consumer surplus is the area between the demand curve and the equilibrium price, up to the equilibrium quantity.
Producer surplus is the area between the supply curve and the equilibrium price, up to the equilibrium quantity.
To visualize these areas, refer to the graph below, which shows the market for ethanol in the U.S. under autarky.
Try solving on your own before revealing the answer!
Q2. Economic Surplus with Trade (Imports Allowed)
Background
Topic: Economic Surplus with International Trade
This question explores how allowing imports affects consumer surplus, producer surplus, and overall economic surplus. It focuses on the changes in market equilibrium when the world price is lower than the domestic price.
Key Terms and Formulas:
World Price: The price at which goods can be bought or sold internationally.
Imports: The difference between domestic consumption and domestic production when the world price is lower than the domestic price.
Economic Surplus: The sum of consumer and producer surplus.
Step-by-Step Guidance
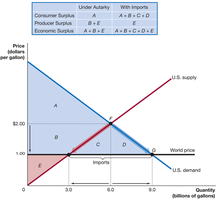
When imports are allowed, the market price drops to the world price (e.g., $1.00 per gallon).
At the world price, determine the new quantity demanded and supplied domestically. The difference is the quantity imported.
Consumer surplus increases because consumers can buy more at a lower price. Producer surplus decreases because domestic producers sell less at a lower price.
Refer to the graph below to see how the areas representing consumer and producer surplus change with imports.

Try solving on your own before revealing the answer!
Q3. Economic Surplus with Trade (Detailed Areas)
Background
Topic: Surplus Distribution with Trade
This question asks you to identify the specific areas on a supply and demand graph that represent consumer surplus, producer surplus, and economic surplus under autarky and with imports.
Key Terms and Formulas:
Area Labels (A, B, C, D, E): Used to denote different regions on the graph for surplus calculations.
Step-by-Step Guidance
Under autarky, consumer surplus is the area above the equilibrium price and below the demand curve (A + B).
Producer surplus is the area below the equilibrium price and above the supply curve (E).
With imports, consumer surplus expands to include additional areas (A + B + C + D), while producer surplus shrinks to E.
Economic surplus is the sum of consumer and producer surplus in each scenario. Use the graph to identify these areas.
Try solving on your own before revealing the answer!
Q4. Tariffs and Quotas: Effects on Surplus and Market Outcomes
Background
Topic: Tariffs, Quotas, and Market Outcomes
This question involves analyzing the effects of tariffs on the price, quantity, consumer surplus, producer surplus, and imports in the sugar market. You are asked to use a supply and demand graph with labeled areas to answer several sub-questions.
Key Terms and Formulas:
Tariff: A tax on imported goods, raising the domestic price above the world price.
Consumer Surplus Loss: The area lost by consumers due to higher prices from the tariff.
Producer Surplus Gain: The area gained by domestic producers due to higher prices.
Imports: The difference between domestic consumption and domestic production at the tariff price.
Step-by-Step Guidance
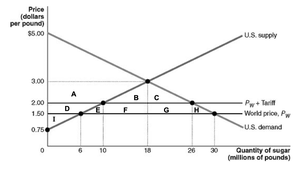
Identify the new price and quantity after the tariff is imposed (e.g., $2.00 per pound and 26 million pounds).
Calculate the loss of consumer surplus by identifying the areas on the graph that are no longer part of consumer surplus (e.g., D + E + F + G + H).
Determine the new quantity supplied by domestic producers at the higher price (e.g., 10 million pounds).
Find the increase in producer surplus (e.g., area D) and the new quantity of imports (e.g., 26 - 10 = 16 million pounds).
Refer to the graph below to visualize these changes.

Try solving on your own before revealing the answer!
