 Back
BackMicroeconomics Exam 4 Review – International Trade & Production Costs
Study Guide - Smart Notes
 Tailored notes based on your materials, expanded with key definitions, examples, and context.
Q1. Economic Surplus with No Trade (Autarky)
Background
Topic: Consumer and Producer Surplus under Autarky
This question is about understanding how economic surplus is distributed between consumers and producers when a country does not engage in international trade (autarky).
Key Terms and Concepts:
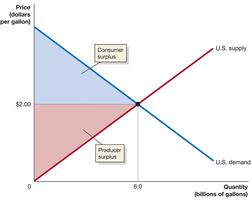
Consumer Surplus: The area above the equilibrium price and below the demand curve.
Producer Surplus: The area below the equilibrium price and above the supply curve.
Autarky: A situation where a country does not trade with other countries.
Step-by-Step Guidance
Identify the equilibrium price and quantity where the domestic supply and demand curves intersect (in this case, at $2.00 per gallon and 6.0 billion gallons).
Consumer surplus is the area between the demand curve and the equilibrium price, up to the equilibrium quantity.
Producer surplus is the area between the supply curve and the equilibrium price, up to the equilibrium quantity.
Economic surplus is the sum of consumer and producer surplus at the autarky equilibrium.
Try solving on your own before revealing the answer!
Q2. Economic Surplus with Trade (Imports Allowed)
Background
Topic: Gains from Trade, Changes in Surplus
This question explores how allowing imports changes the market equilibrium, consumer surplus, producer surplus, and overall economic surplus.
Key Terms and Concepts:
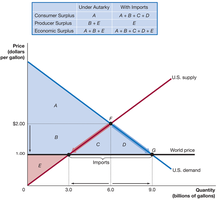
World Price: The price at which goods can be bought or sold internationally (here, $1.00 per gallon).
Imports: The difference between domestic consumption and domestic production at the world price.
Changes in Surplus: How consumer and producer surplus are affected by trade.
Step-by-Step Guidance
Find the new equilibrium price (world price) and determine the new quantities for domestic production and consumption.
Calculate the increase in consumer surplus (area above the world price and below the demand curve).
Calculate the decrease in producer surplus (area below the world price and above the supply curve).
Determine the total economic surplus and compare it to the autarky case.
Try solving on your own before revealing the answer!
Q3. Economic Surplus with Trade (Imports Allowed) – Table Reference
Background
Topic: Surplus Calculations with Trade
This question asks you to use the graph and table to identify areas representing consumer surplus, producer surplus, and economic surplus under both autarky and trade.
Key Terms and Concepts:
Area Labels (A, B, C, D, E): Used to identify specific regions on the graph for surplus calculations.
Comparison: Understanding how the areas change when moving from autarky to trade.
Step-by-Step Guidance
Refer to the labeled areas on the graph and match them to the table for both autarky and trade scenarios.
Identify which areas are gained or lost by consumers and producers when trade is allowed.
Calculate the net change in economic surplus by comparing the total areas before and after trade.
Try solving on your own before revealing the answer!
Q4. Tariffs and Their Effects (Figure 9-4)
Background
Topic: Tariffs, Consumer Surplus, Producer Surplus, and Imports
This question involves analyzing the effects of a tariff on the domestic market for sugar, using a supply and demand graph with labeled areas and quantities.
Key Terms and Concepts:
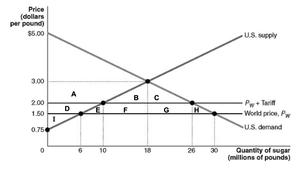
Tariff: A tax on imported goods, raising the domestic price above the world price.
Consumer Surplus Loss: The area lost by consumers due to higher prices.
Producer Surplus Gain: The area gained by domestic producers due to higher prices.
Imports: The difference between domestic consumption and domestic production at the tariff price.
Step-by-Step Guidance
Identify the new price and quantity after the tariff is imposed (use the graph to find these values).
Determine the areas representing the loss of consumer surplus and the gain in producer surplus.
Calculate the new quantity supplied by domestic producers and the new quantity of imports.
Find the reduction in domestic consumption due to the tariff.
Try solving on your own before revealing the answer!
