 Back
BackMicroeconomics Exam Study Guide: Elasticity, Market Structures, and Labor Markets
Study Guide - Smart Notes
 Tailored notes based on your materials, expanded with key definitions, examples, and context.
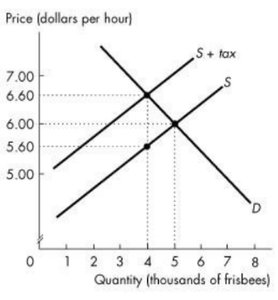
Q17. Refer to the figure below showing the market for frisbees before and after a tax is imposed. On each frisbee, the buyers' share of the tax is
Background
Topic: Tax Incidence and Market Equilibrium
This question tests your understanding of how taxes affect supply and demand, and how the burden of a tax is shared between buyers and sellers in a market.
Key Terms and Formulas
Tax incidence: The division of the tax burden between buyers and sellers.
Supply curve (S): Shows the relationship between price and quantity supplied.
Demand curve (D): Shows the relationship between price and quantity demanded.
Vertical distance between S and S + tax: Represents the amount of tax per unit.
Buyers' share of tax: The difference between the price buyers pay after the tax and the equilibrium price before the tax.
Step-by-Step Guidance
Examine the graph and identify the equilibrium price and quantity before the tax is imposed (where S and D intersect).
Locate the new equilibrium after the tax is imposed (where S + tax and D intersect). This is the price buyers pay after the tax.
Find the price sellers receive after the tax (where S and D intersect at the new quantity).
Calculate the buyers' share of the tax by subtracting the original equilibrium price from the price buyers pay after the tax.
Try solving on your own before revealing the answer!
Final Answer: $0.60
The buyers' share of the tax is the difference between the price buyers pay after the tax ($6.60) and the original equilibrium price ($6.00): $6.60 - $6.00 = $0.60.
This means buyers pay $0.60 more per frisbee due to the tax, while sellers receive less than before.
