 Back
BackMicroeconomics: Foundations, Production, Efficiency, and Market Dynamics
Study Guide - Smart Notes
 Tailored notes based on your materials, expanded with key definitions, examples, and context.
Microeconomics: Foundations and Models
Definition of Economics
Economics is the study of how limited and scarce resources are allocated across society. It investigates how individuals and societies coordinate their wants and desires to maximize welfare given scarcity.
Scarcity: Not enough goods or resources to satisfy all desires.
Macroeconomics: Studies the economy as a whole (growth, unemployment, inflation).
Microeconomics: Studies individual and firm choices, and how they are influenced by economic forces.
Key Economic Questions
Every society must answer:
What to Produce?
How to Produce?
For Whom to Produce?
How these questions are answered determines prosperity, wealth distribution, and available products/services.
Economic Policy
Economic policies: Government decisions influencing economic behavior.
Positive economics: Objective data analysis.
Normative economics: Subjective beliefs and values.
Economic Reasoning
Marginal cost: Additional cost from choosing an action.
Marginal benefit: Additional benefit from choosing an action.
Opportunity cost: Value of the next-best alternative forgone.
Economic decision rule: Choose an action if marginal benefits exceed marginal costs.
Economic Organization of Society
Types of Economic Systems
Capitalism: Private property and market forces determine production and distribution. Key features include private property rights, self-interest, laissez-faire, and perfect competition.
Welfare capitalism: Market system with significant government regulation to provide welfare, based on Keynesian theory.
Socialism: Government ownership and control of property and economic decisions.
Communism: Collective ownership and central planning for production and distribution.

Production Possibility Curves & Efficiency
Production Process and Factors of Production
The production process uses inputs (land, labor, capital, entrepreneurship) to produce outputs. Each input receives a factor payment: rent (land), wages (labor), interest (capital), profits (entrepreneurship).
Production Possibility Curve (PPC)
The PPC shows the maximum combinations of two outputs achievable with given inputs, illustrating trade-offs and opportunity costs.
Technical efficiency: Achieving maximum output from given inputs.
Allocative efficiency: Producing the combination of goods/services that maximizes societal welfare.
Increasing opportunity costs: The PPC is bowed outward, indicating that more of one good requires giving up increasing amounts of the other.
Shifts in PPC: Outward shifts occur with more resources, better technology, or higher education.
Inefficiency: Points inside the curve represent underutilization of resources.
Comparative and Absolute Advantage
Comparative advantage: Ability to produce at lower opportunity cost than others.
Absolute advantage: Ability to produce more output with the same resources.
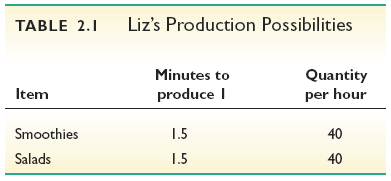
Example: Liz and Joe's Smoothie Bars
Liz and Joe have different production possibilities for smoothies and salads.
Item | Minutes to produce 1 | Quantity per hour |
|---|---|---|
Smoothies | 1.5 | 40 |
Salads | 1.5 | 40 |
Item | Minutes to produce 1 | Quantity per hour |
|---|---|---|
Smoothies | 10 | 6 |
Salads | 2 | 30 |
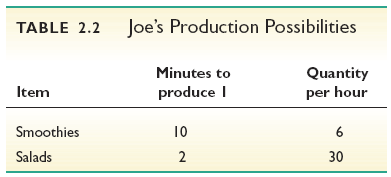
Liz has both absolute and comparative advantage in smoothies; Joe has comparative advantage in salads. Gains from trade allow both to be better off.
Supply and Demand
Demand
Law of demand: Quantity demanded rises as price falls (for normal goods).
Demand curve: Downward sloping, showing inverse relationship between price and quantity demanded.
Movement along the curve: Caused by price changes.
Shift of the curve: Caused by changes in income, prices of related goods, tastes, expectations.
Market demand: Horizontal sum of individual demand curves.
Supply
Law of supply: Quantity supplied rises as price rises.
Supply curve: Upward sloping, showing direct relationship between price and quantity supplied.
Movement along the curve: Caused by price changes.
Shift of the curve: Caused by changes in input prices, technology, expectations, taxes/subsidies, alternative outputs.
Market supply: Horizontal sum of individual firm supply curves.
Market Equilibrium
Market equilibrium occurs when quantity demanded equals quantity supplied. Prices adjust to clear the market.
Surplus: Quantity supplied exceeds quantity demanded; prices fall.
Shortage: Quantity demanded exceeds quantity supplied; prices rise.
Price controls: Government-imposed price ceilings (below equilibrium) create shortages; price floors (above equilibrium) create surpluses.
Consumer and Producer Surplus
Consumer surplus: Difference between maximum price willing to pay and actual price paid.
Producer surplus: Difference between actual price received and minimum acceptable price.
Efficiency: Maximum combined consumer and producer surplus at equilibrium quantity.
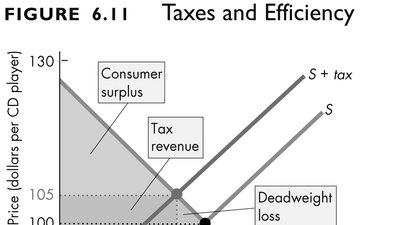
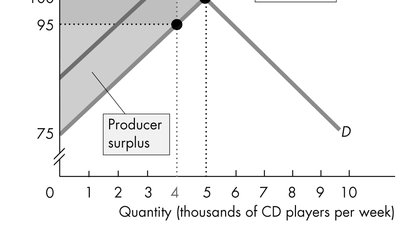
Taxes and Market Efficiency
Tax Incidence
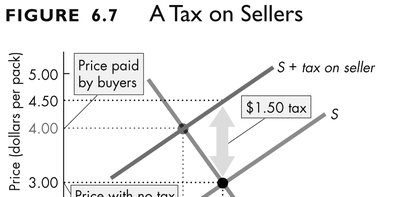
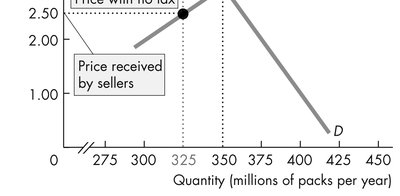
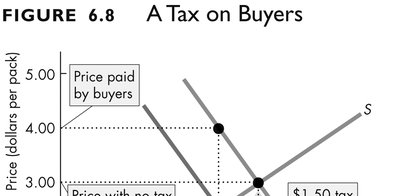
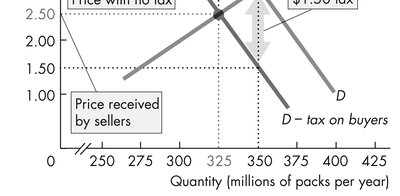
Tax incidence refers to how the burden of a tax is shared between buyers and sellers. The tax creates a wedge between the price paid by buyers and the price received by sellers.
Tax on sellers: Supply curve shifts up by the amount of the tax.
Tax on buyers: Demand curve shifts down by the amount of the tax.
Deadweight loss: Taxes create inefficiency by reducing potential gains from trade.
Equivalence of Tax on Buyers and Sellers
Placing a tax on buyers or sellers results in the same new equilibrium price and quantity. The division of the tax burden depends on the relative elasticities of demand and supply.
If demand is more inelastic than supply, consumers bear more of the tax.
If supply is more inelastic than demand, producers bear more of the tax.
Market Inefficiency and Market Failure
Pareto Efficiency
Pareto efficiency occurs when no further trades can make someone better off without making someone else worse off. Perfect competition achieves Pareto efficiency.
Sources of Market Inefficiency
Imperfect competition: Monopolies reduce consumer surplus and create deadweight loss.
Irrational behavior: Individuals may not always maximize utility or profits.
Uncertainty: Decisions often made with limited information.
Asymmetric information: One party has more information than the other, leading to adverse selection (before transaction) and moral hazard (after transaction).
Self-interest: Not always leads to efficient outcomes; altruism can affect decisions.
Sunk costs: Past expenditures should not affect future decisions, but often do.
Public Goods
Non-rivalry: One person's consumption does not reduce another's.
Non-excludability: Cannot prevent others from benefiting.
Free-rider problem: Individuals benefit without paying, leading to under-provision by private sector.
Government provision: Public goods are provided collectively and financed through taxation.
Externalities
Negative externality: Costs imposed on others (e.g., pollution).
Positive externality: Benefits received by others (e.g., pollination).
Government intervention: Regulations, taxes, subsidies, or tradable licenses to address externalities.
Coase Theorem: Efficient outcomes can be achieved through bargaining if property rights are well defined and transaction costs are low.

Elasticity: The Responsiveness of Demand and Supply
Price Elasticity of Demand
Price elasticity of demand measures how responsive quantity demanded is to a change in price.
Formula:
Elasticity ranges:
EP = 0: Perfectly inelastic
0 < EP < 1: Inelastic
EP = 1: Unitary elastic
EP > 1: Elastic
EP = ∞: Perfectly elastic
Determinants: Number of substitutes, necessity vs. luxury, share of income, time frame.
Price Elasticity of Supply
Formula:
Major determinant: Time available for producers to respond.
Income Elasticity
Formula:
Interpretation: Positive EY indicates normal goods; negative EY indicates inferior goods.
Cross Price Elasticity
Formula:
Interpretation: Positive EXY indicates substitutes; negative EXY indicates complements.
Elasticity and Tax Incidence
If demand is more inelastic than supply, consumers bear more of the tax.
If supply is more inelastic than demand, producers bear more of the tax.
Example: If property taxes increase, landlords may shift the burden to tenants if there are few alternatives; otherwise, landlords bear the burden.
Price Change | When D is Elastic | Unitary Elastic | Inelastic |
|---|---|---|---|
Decrease | TR Rises | Unchanged | TR Falls |
Increase | TR Falls | Unchanged | TR Rises |
Additional info: These notes cover foundational microeconomic concepts, including models, efficiency, market dynamics, and elasticity, suitable for exam preparation.
