 Back
BackMicroeconomics Study Guide: Consumers and Incentives
Study Guide - Smart Notes
 Tailored notes based on your materials, expanded with key definitions, examples, and context.
Consumers and Incentives
Key Concepts in Consumer Choice
Consumer behavior in microeconomics is shaped by preferences, prices, and budget constraints. Understanding how buyers make decisions helps explain demand, consumer surplus, and elasticity.
Preferences: Reflect the relative valuation of goods and activities. Consumers aim to maximize satisfaction (utility) given their tastes.
Prices: Represent the cost of goods. In competitive markets, consumers are price takers and cannot influence prices.
Budget: The total income available for spending. Consumers must allocate their budget across goods to maximize utility.
Opportunity Cost: The value of the next best alternative forgone when making a choice.

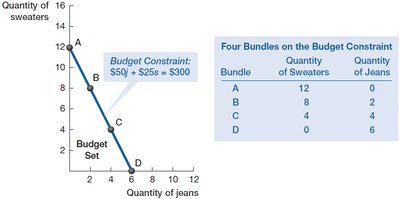
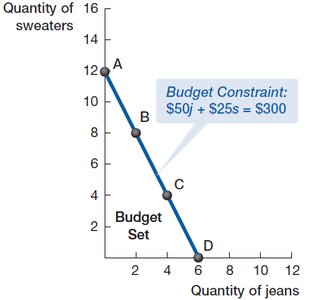
The Budget Set and Budget Constraint
The budget set consists of all possible combinations of goods a consumer can afford given their income and the prices of goods. The budget constraint is the boundary of this set, showing the maximum quantities of goods that can be purchased.
Budget Line Equation: where and are prices, and are quantities, and is income.
Slope of Budget Line: , representing the opportunity cost of one good in terms of the other.
Opportunity Cost and Trade-offs
Opportunity cost is central to consumer choice. The slope of the budget line shows the constant trade-off between two goods.
Opportunity Cost of Jeans: Number of sweaters forgone per additional pair of jeans.
Opportunity Cost of Sweaters: Number of jeans forgone per additional sweater.
Formula:
Optimization: Marginal Analysis
Consumers optimize by equating the marginal benefit per dollar spent across goods. This ensures the last dollar spent yields equal additional satisfaction for each good.
Marginal Benefit (MB): The additional satisfaction from consuming one more unit.
Optimization Rule:
Example: If sweaters cost $25 and jeans $50, compare marginal benefits per dollar to decide how many of each to buy.
Quantity | Total Benefits (Sweaters) | Marginal Benefits (Sweaters) | Marginal Benefits per Dollar (Sweaters) | Total Benefits (Jeans) | Marginal Benefits (Jeans) | Marginal Benefits per Dollar (Jeans) |
|---|---|---|---|---|---|---|
4 | 325 | 65 | 2.6 | 490 | 80 | 1.6 |
5 | 385 | 60 | 2.4 | 520 | 30 | 0.6 |
6 | 435 | 50 | 2 | 530 | 10 | 0.2 |
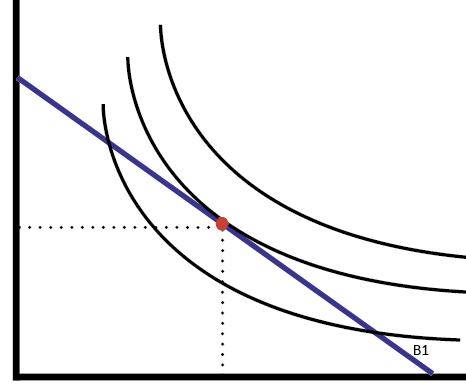
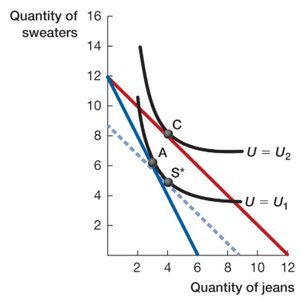
Indifference Curves and Consumer Equilibrium
Indifference curves represent combinations of goods that yield equal satisfaction. The optimal consumption bundle is where the budget constraint is tangent to the highest attainable indifference curve.
Indifference Curve: Downward sloping and convex to the origin due to diminishing marginal rate of substitution (MRS).
Marginal Rate of Substitution (MRS): , the rate at which a consumer is willing to trade one good for another.
Consumer Equilibrium:

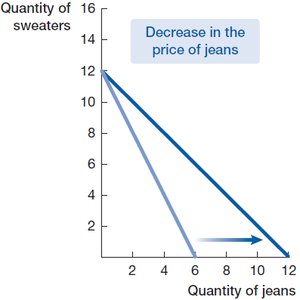
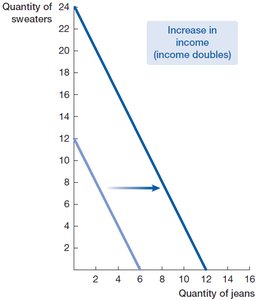
Effects of Price and Income Changes
Changes in price or income shift the budget constraint and affect the optimal consumption bundle. These effects are decomposed into the substitution effect and income effect.
Substitution Effect: Change in consumption due to a change in relative prices, moving along the same indifference curve.
Income Effect: Change in consumption due to a change in purchasing power, moving to a new indifference curve.
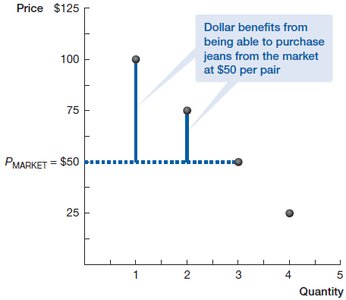
Consumer Surplus
Consumer surplus is the difference between what a buyer is willing to pay and what they actually pay. It measures the net benefit to consumers from market transactions.
Formula: Area between the demand curve and the price line, up to the quantity purchased.
Example: If the market price for jeans is $50 and the buyer would pay up to $100 for the first pair, the surplus is $50.
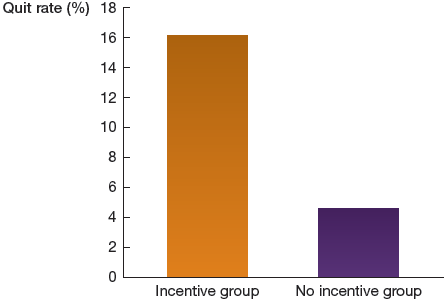
Behavioral Economics and Incentives
Monetary incentives can influence consumer behavior, such as quitting smoking or increasing vaccination rates. Behavioral economics studies how such 'nudges' affect decision-making.
Example: Offering $100/month to quit smoking increases quit rates.
Experimental Results: Incentive groups show higher quit rates compared to no incentive groups.
Elasticity of Demand
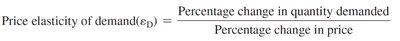
Price Elasticity of Demand
Price elasticity of demand measures how sensitive quantity demanded is to price changes. It is a key concept for understanding consumer responsiveness and for firms setting prices.
Formula:
Interpretation: Elasticity greater than 1 is elastic, less than 1 is inelastic, and equal to 1 is unit elastic.
Determinants of Price Elasticity
Substitution Possibilities: More substitutes lead to higher elasticity.
Budget Share: Goods that take up a larger share of the budget are more elastic.
Time: Elasticity increases over time as consumers adjust.
Elasticity and Revenue
Elasticity affects how changes in price impact total revenue for firms.
Price Elasticity | Increasing Price | Decreasing Price |
|---|---|---|
Elastic (ED > 1) | Decreases Revenue | Increases Revenue |
Unitary Elastic (ED = 1) | No Change | No Change |
Inelastic (ED < 1) | Increases Revenue | Decreases Revenue |
Other Elasticities
Cross-Price Elasticity: Measures how the quantity demanded of one good changes in response to the price change of another good.
Income Elasticity: Measures how quantity demanded changes as income changes.


Applications and Practice Problems
Budget Set and Marginal Analysis Example
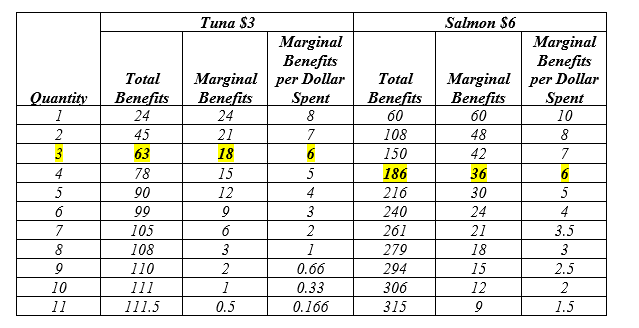
Jackson has a $33 budget to spend on tuna ($3 each) and salmon ($6 each). The optimal combination is found by comparing marginal benefits per dollar spent for each unit.
Quantity | Total Benefits (Tuna) | Marginal Benefits (Tuna) | Marginal Benefits per Dollar (Tuna) | Total Benefits (Salmon) | Marginal Benefits (Salmon) | Marginal Benefits per Dollar (Salmon) |
|---|---|---|---|---|---|---|
3 | 63 | 18 | 6 | 186 | 36 | 6 |
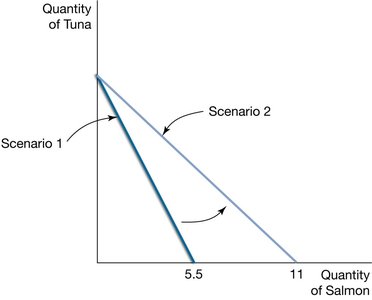
Budget Constraint Graphs
Graphical representation of Jackson's budget constraint for two scenarios: price of salmon changes from $6 to $3.
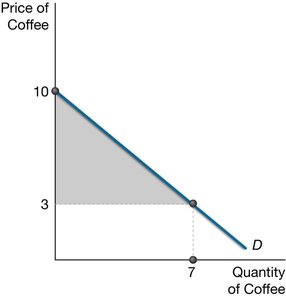
Consumer Surplus Example
Alex's demand for coffee is . If the price is $3, Alex buys 7 cups. Consumer surplus is the area between the demand curve and the price line.
Summary Table: Marginal Benefits and Optimization
Quantity | Total Benefits (Sweaters) | Marginal Benefits (Sweaters) | Marginal Benefits per Dollar (Sweaters) | Total Benefits (Jeans) | Marginal Benefits (Jeans) | Marginal Benefits per Dollar (Jeans) |
|---|---|---|---|---|---|---|
4 | 325 | 65 | 2.6 | 490 | 80 | 1.6 |
5 | 385 | 60 | 2.4 | 520 | 30 | 0.6 |
6 | 435 | 50 | 2 | 530 | 10 | 0.2 |
Conclusion
Consumer choice theory integrates preferences, prices, and budget constraints to explain demand, consumer surplus, and elasticity. Marginal analysis and graphical tools such as indifference curves and budget lines are essential for understanding optimal consumption and the effects of price and income changes.
