 Back
BackMicroeconomics Study Guide: Elasticity, Utility, and Costs of Production
Study Guide - Smart Notes
 Tailored notes based on your materials, expanded with key definitions, examples, and context.
Chapter 6: Elasticity
Price Elasticity of Demand
Price elasticity of demand quantifies how much the quantity demanded of a good responds to changes in its price. It is a fundamental concept for understanding consumer behavior and market dynamics.
Elastic: Value greater than 1; quantity demanded responds strongly to price changes.
Inelastic: Value less than 1; quantity demanded responds weakly to price changes.
Unit elastic: Value equal to 1; quantity demanded changes proportionally to price.
Perfectly elastic: Value is infinite; consumers buy only at one price.
Perfectly inelastic: Value is 0; quantity demanded does not change when price changes.
Determinants of Elasticity
The elasticity of demand depends on several factors:
Availability of substitutes: More substitutes make demand more elastic.
Luxury vs. necessity: Luxuries are more elastic; necessities are more inelastic.
Share of income: Goods taking a large share of income are more elastic.
Time horizon: Demand is more elastic in the long run as consumers adjust.
Total Revenue Test
Total revenue is calculated as price multiplied by quantity. The effect of price changes on total revenue depends on elasticity:
If demand is elastic: Price increase lowers total revenue; price decrease raises total revenue.
If demand is inelastic: Price increase raises total revenue; price decrease lowers total revenue.
Price Elasticity of Supply
Price elasticity of supply measures how responsive quantity supplied is to price changes. Supply is more elastic when firms can adjust production easily and inputs are readily available.
Cross-Price Elasticity of Demand
Cross-price elasticity measures how demand for one good changes in response to the price change of another good:
Positive value: Goods are substitutes.
Negative value: Goods are complements.
Income Elasticity of Demand
Income elasticity measures how demand changes with consumer income:
Positive value: Normal good.
Negative value: Inferior good.
Value greater than 1: Luxury good.
Step‑by‑Step Elasticity Example (Midpoint Formula)
To calculate price elasticity of demand using the midpoint formula:
Change in quantity:
Average quantity:
Percentage change in quantity:
Change in price:
Average price:
Percentage change in price:
Elasticity:
Example: If price rises from $4 to $6 and quantity demanded falls from 120 to 80, PED = -1 (unit elastic).
Chapter 10: Utility and Consumer Choice
Total Utility and Marginal Utility
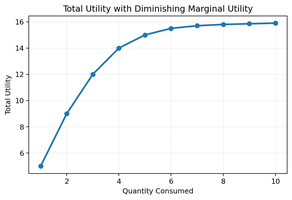
Utility represents the satisfaction a consumer receives from consuming goods and services. Total utility is the overall satisfaction, while marginal utility is the additional satisfaction from consuming one more unit.
Total Utility: The sum of satisfaction from all units consumed.
Marginal Utility: The change in total utility from consuming an additional unit.
Law of Diminishing Marginal Utility
As more units of a good are consumed, the marginal utility from each additional unit decreases. This principle explains why demand curves slope downward.
First units: Provide higher satisfaction.
Later units: Provide less additional satisfaction.
Utility Maximization Rule
Consumers maximize utility by allocating their income so that the marginal utility per dollar spent is equal across all goods, and all income is spent.
Rule:
Budget constraint: Total spending must not exceed income.
Example: If Pizza costs \frac{MU_{Pizza}}{P_{Pizza}} = \frac{MU_{Soda}}{P_{Soda}}$ and all income is spent.
Chapter 11: Production and Cost
Marginal Product and Diminishing Returns
Firms use inputs to produce output. In the short run, at least one input is fixed. Marginal product is the additional output from one more unit of input. Diminishing returns occur when adding more of a variable input leads to a smaller increase in output.
Marginal Product:
Diminishing Returns: Marginal product rises at first due to specialization, then falls as more input is added.
Cost Concepts
Understanding cost structures is essential for firms:
Fixed Costs (FC): Do not change with output.
Variable Costs (VC): Change as output changes.
Total Cost (TC):
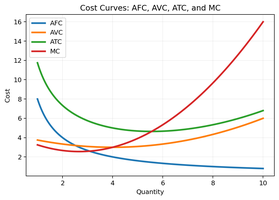
Average and Marginal Cost Curves
Cost curves illustrate how costs change with output:
Average Fixed Cost (AFC): Declines as output increases.
Average Variable Cost (AVC): Typically U-shaped.
Average Total Cost (ATC): U-shaped.
Marginal Cost (MC): Falls at first, then rises.
MC intersects AVC and ATC at their minimum points.
Formula Sheet
Price Elasticity of Demand:
Midpoint Formula:
Price Elasticity of Supply:
Cross-Price Elasticity:
Income Elasticity:
Total Revenue:
Marginal Utility:
Utility Maximization Rule:
Marginal Product of Labor:
Total Cost:
Average Total Cost:
Average Fixed Cost:
Average Variable Cost:
Marginal Cost:
