Back
Backquestions compilation
Study Guide - Smart Notes
 Tailored notes based on your materials, expanded with key definitions, examples, and context.
Q1. Why do governments intervene in the education market? Name two reasons.
Background
Topic: Government Intervention & Market Failure
This question tests your understanding of why governments may step in to regulate or subsidize markets, especially when positive externalities or equity concerns are present.
Positive Externality: A benefit received by people other than the direct consumer or producer of a good.
Market Failure: When the free market does not allocate resources efficiently on its own.
Equity: Fairness in the distribution of resources.
Step-by-Step Guidance
Think about the benefits of education that go beyond the individual student (e.g., a more educated workforce benefits society).
Consider whether all families can afford education in a purely private market, and what that means for social mobility.
Reflect on how government intervention (like subsidies) can address these issues.
Q2. If the elasticity of demand for cocaine is -0.2 and the price rises by 50%, will buyers spend less on cocaine?
Background
Topic: Price Elasticity of Demand & Total Revenue
This question examines your understanding of how the elasticity of demand affects total expenditure when prices change.
Price Elasticity of Demand ():
Inelastic Demand:
Total Expenditure: Price × Quantity
Step-by-Step Guidance
Recall that when demand is inelastic, the percentage drop in quantity demanded is smaller than the percentage increase in price.
Think about what happens to total expenditure (or total revenue) when price increases and demand is inelastic.
Apply the elasticity value to reason through the direction of change in total expenditure.
Q3. Hong Kong government imposed an import duty on tobacco. Who bears the larger portion of the tax, and why?
Background
Topic: Tax Incidence & Elasticity
This question is about how the burden of a tax is shared between buyers and sellers, depending on the elasticity of demand and supply.
Tax Incidence: The division of a tax burden between buyers and sellers.
Elasticity: Responsiveness of quantity demanded or supplied to price changes.
Negative Externality: A cost imposed on others (e.g., second-hand smoke).
Step-by-Step Guidance
Recall that the side of the market (buyers or sellers) that is less elastic (less responsive to price changes) bears more of the tax burden.
Consider the addictive nature of cigarettes and how that affects the elasticity of demand.
Think about how the supply and demand curves shift when a tax is imposed, and how this relates to who pays more of the tax.
Q4. Can the cigarette market reach the socially optimal production rate without government intervention?
Background
Topic: Market Failure & Externalities
This question tests your understanding of negative externalities and the role of government in correcting market outcomes.
Social Optimum: The level of production/consumption that maximizes total welfare, accounting for externalities.
Marginal Social Cost (MSC): The cost to society of producing one more unit, including external costs.
Marginal Benefit (MB): The benefit to consumers from consuming one more unit.
Step-by-Step Guidance
Recall that negative externalities (like second-hand smoke) mean the market supply curve does not reflect the true cost to society.
Think about whether the market will overproduce or underproduce cigarettes compared to the social optimum.
Consider how a tax (like a tobacco duty) can shift the market toward the socially optimal quantity.
Q5. Which of the following is a microeconomics question?
Background
Topic: Microeconomics vs. Macroeconomics
This question tests your ability to distinguish between microeconomic and macroeconomic topics.
Microeconomics: The study of individual markets and the behavior of households and firms.
Macroeconomics: The study of the economy as a whole, including inflation, unemployment, and economic growth.
Step-by-Step Guidance
Read each option and identify whether it focuses on individual markets or the economy as a whole.
Recall that questions about prices and quantities in specific markets are microeconomic.
Eliminate options that deal with aggregate outcomes like unemployment or GDP.
Q6. The existence of a tradeoff along the PPF means that the PPF is ________.
Background
Topic: Production Possibilities Frontier (PPF)
This question tests your understanding of opportunity cost and the shape of the PPF.
PPF: A curve showing the maximum attainable combinations of two products that may be produced with available resources and technology.
Opportunity Cost: The value of the next best alternative forgone.
Step-by-Step Guidance
Recall that a bowed-outward PPF reflects increasing opportunity costs as more of one good is produced.
Think about what a straight-line or bowed-inward PPF would imply about opportunity costs.
Use the diagram to visualize the tradeoff between the two goods.
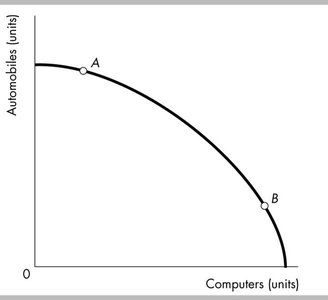
Q7. According to the figure, the opportunity cost of producing another computer is higher at which point?
Background
Topic: Opportunity Cost & PPF
This question asks you to interpret a PPF diagram and compare opportunity costs at different points.
Opportunity Cost: The amount of one good that must be given up to produce more of another good.
Step-by-Step Guidance
Look at the slope of the PPF at points A and B. The steeper the slope, the higher the opportunity cost of producing more computers.
Recall that as you move along a bowed-outward PPF, the opportunity cost of producing one good typically increases.
Compare the positions of A and B to determine where the opportunity cost is higher.
Q8. Missouri and Washington can produce pecans and pears. Who has the absolute and comparative advantage?
Background
Topic: Absolute vs. Comparative Advantage
This question tests your ability to calculate and compare opportunity costs and output levels between two producers.
Absolute Advantage: The ability to produce more of a good with the same resources.
Comparative Advantage: The ability to produce a good at a lower opportunity cost.
Step-by-Step Guidance
Calculate the maximum output of each good for both Missouri and Washington.
Determine who can produce more of each good (absolute advantage).
Calculate the opportunity cost of producing each good for both states to find comparative advantage.
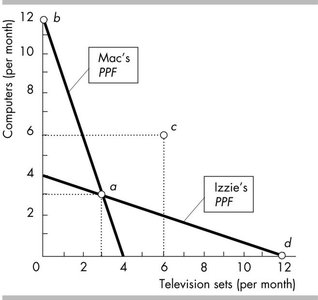
Q9. If Mac and Izzie specialize and trade to reach point c, what is the likely exchange?
Background
Topic: Specialization, Trade, and PPF
This question asks you to interpret a PPF diagram and understand the gains from specialization and trade.
Specialization: Focusing resources on the production of one good where opportunity cost is lowest.
Trade: Exchanging goods to achieve consumption outside the individual PPFs.
Step-by-Step Guidance
Identify the production points for Mac and Izzie before and after trade.
Determine the terms of trade that allow both to benefit.
Use the diagram to match the exchange that achieves point c.
Q10. What is the price elasticity of demand for corn using the midpoint method?
Background
Topic: Price Elasticity of Demand
This question tests your ability to calculate elasticity using the midpoint formula.
Step-by-Step Guidance
Identify the initial and new prices and quantities: , , , (in millions).
Calculate the percentage change in quantity demanded using the midpoint formula.
Calculate the percentage change in price using the midpoint formula.
Divide the percentage change in quantity by the percentage change in price to find elasticity.
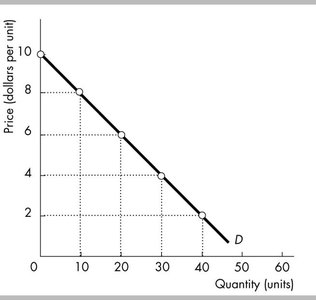
Q11. At the midpoint of a straight-line demand curve, what is the price elasticity of demand?
Background
Topic: Price Elasticity of Demand & Demand Curves
This question tests your understanding of elasticity at different points on a linear demand curve.
Midpoint: The point halfway along the demand curve.
Unit Elastic: Elasticity equals 1.
Step-by-Step Guidance
Recall that for a straight-line demand curve, elasticity varies along the curve.
At the midpoint, the percentage change in quantity equals the percentage change in price, so elasticity is 1.
Use the diagram to identify the midpoint and relate it to elasticity.
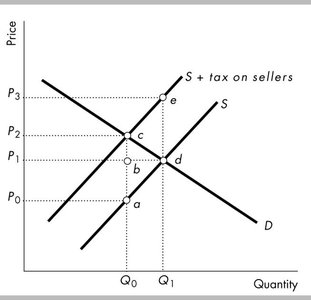
Q12. What is the effect of a tax on sellers in the supply and demand diagram?
Background
Topic: Tax Incidence & Market Equilibrium
This question asks you to interpret a supply and demand diagram with a tax imposed on sellers.
Tax Wedge: The vertical distance between the supply and demand curves equal to the tax.
Consumer's Share of Tax: The portion of the tax paid by buyers, reflected in a higher price.
Step-by-Step Guidance
Identify the original supply curve and the new supply curve after the tax is imposed.
Find the new equilibrium price and quantity.
Measure the difference between the price buyers pay and the price sellers receive to determine the tax incidence.