 Back
BackMicroeconomics Study Guide: Key Concepts and Graphical Analysis
Study Guide - Smart Notes
 Tailored notes based on your materials, expanded with key definitions, examples, and context.
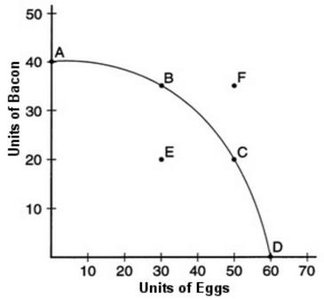
Q2.10: If the economy is operating at point C, which one of the following is the opportunity cost of producing an additional 15 units of bacon?
Background
Topic: Production Possibilities Frontier (PPF) and Opportunity Cost
This question tests your understanding of how to interpret a PPF graph and calculate the opportunity cost of shifting production from one good to another.
Key Terms and Formulas:
Production Possibilities Frontier (PPF): A curve showing the maximum attainable combinations of two products that may be produced with available resources and technology.
Opportunity Cost: The value of the next best alternative foregone when making a choice.
Step-by-Step Guidance
Locate point C on the PPF graph and note the quantities of bacon and eggs produced at this point.
Identify the change in production: producing 15 more units of bacon means moving leftward/upward along the PPF.
Find the two points on the PPF that correspond to the current and new production levels (before and after the increase in bacon).
Calculate the decrease in eggs associated with the increase in bacon (the opportunity cost is the number of eggs forgone).
Try solving on your own before revealing the answer!
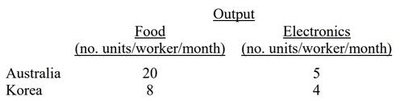
Q3.9: Which one of the following is the opportunity cost of 1 unit of electronics in Australia?
Background
Topic: Comparative Advantage and Opportunity Cost
This question asks you to calculate the opportunity cost of producing one unit of electronics in Australia using the provided output table.
Key Terms and Formulas:
Opportunity Cost: The amount of one good that must be given up to produce an additional unit of another good.
Formula:
Step-by-Step Guidance
From the table, note Australia's output per worker per month: 20 units of food or 5 units of electronics.
To find the opportunity cost of 1 unit of electronics, determine how much food must be forgone to produce 1 more unit of electronics.
Set up the ratio:
Try solving on your own before revealing the answer!
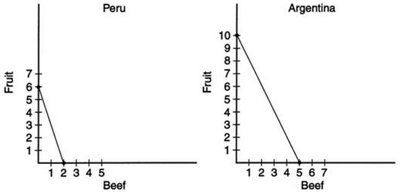
Q3.19: Which one of the following is the opportunity cost of producing a tonne of beef in Peru?
Background
Topic: Comparative Advantage and Opportunity Cost (PPF)
This question uses the PPF graphs for Peru and Argentina to determine the opportunity cost of producing beef in Peru.
Key Terms and Formulas:
Opportunity Cost: The amount of fruit that must be given up to produce one more tonne of beef.
Formula:
Step-by-Step Guidance
Look at Peru's PPF: the endpoints show the maximum possible production of fruit and beef.
Calculate the opportunity cost by dividing the maximum fruit by the maximum beef for Peru.
Set up the ratio:
Try solving on your own before revealing the answer!
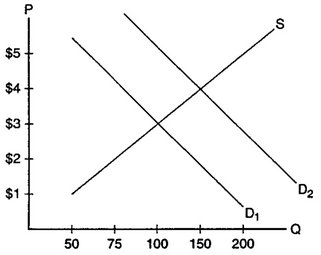
Q4.5: Referring to the graph above, which one of the following describes the initial equilibrium price and quantity?
Background
Topic: Market Equilibrium (Supply and Demand)
This question asks you to identify the equilibrium price and quantity from a supply and demand graph for personal-sized pizzas.
Key Terms and Formulas:
Equilibrium Price: The price at which quantity demanded equals quantity supplied.
Equilibrium Quantity: The quantity bought and sold at the equilibrium price.
Step-by-Step Guidance
Locate the intersection point of the supply and demand curves on the graph.
Read the price (P) and quantity (Q) values at this intersection.
Match these values to the options provided in the question.
Try solving on your own before revealing the answer!
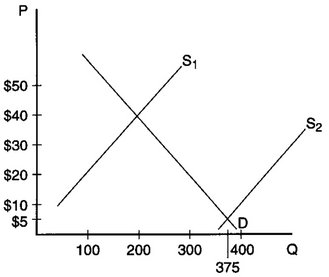
Q4.9: Referring to the graph above, which one of the following describes the initial equilibrium price and quantity?
Background
Topic: Market Equilibrium (Supply and Demand)
This question asks you to identify the equilibrium price and quantity from a supply and demand graph for hand-held calculators.
Key Terms and Formulas:
Equilibrium Price: The price at which quantity demanded equals quantity supplied.
Equilibrium Quantity: The quantity bought and sold at the equilibrium price.
Step-by-Step Guidance
Locate the intersection point of the supply and demand curves on the graph.
Read the price (P) and quantity (Q) values at this intersection.
Match these values to the options provided in the question.
Try solving on your own before revealing the answer!
