 Back
BackMicroeconomics Study Guide: Prosperity, Inequality, and Planetary Limits
Study Guide - Smart Notes
 Tailored notes based on your materials, expanded with key definitions, examples, and context.
Basic Principles of Economics
Prosperity, Inequality, and Planetary Limits
This section introduces foundational concepts in economics, focusing on the historical evolution of living standards, the measurement of economic output, and the role of institutions and technology. It also addresses the environmental and social limits to economic growth.
Living Standards: Historically, living standards remained low and stable for centuries, but have risen sharply in the past two hundred years due to technological change and industrialization.
Economic Theories: Theories such as the Malthusian trap explain periods of stagnation, while others account for rapid growth during the Industrial Revolution.
Role of the State: Effective states guide market activity and establish laws and regulations that influence economic performance.
Developmental State: Governments can play a leading role in promoting economic take-off and sustained growth.
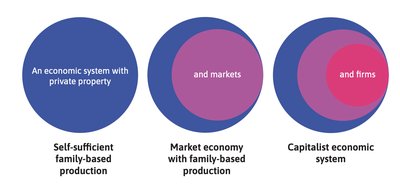
Institutions: Private property, markets, and firms are essential for sustained increases in living standards.
Reading and Understanding Graphs
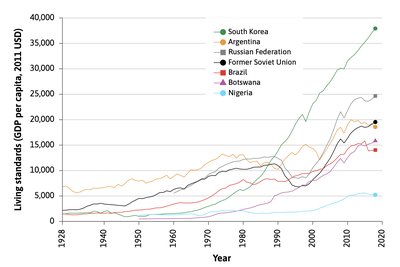
History's Hockey Stick and Cross-Country Comparisons
Graphs are essential tools for visualizing economic data, such as GDP per capita and income distribution. Understanding these graphs helps interpret economic trends and disparities.
Hockey Stick Graph: Shows the sharp increase in living standards in some countries, with different shapes and timing across nations.
Cross-Country Comparisons: Graphs illustrate how countries like South Korea, Nigeria, and China have experienced different growth trajectories.
Introductory Economic Models
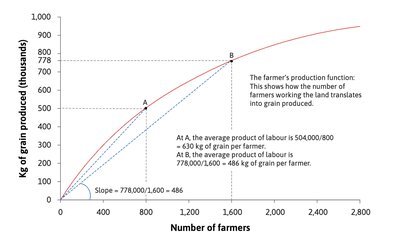
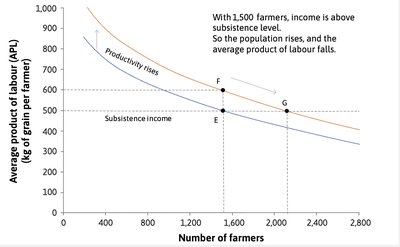
Malthusian Model and the Poverty Trap
The Malthusian model explains the long period of stable living standards by showing how population growth offsets technological progress, keeping income at subsistence levels.
Production Function: , where is grain produced and is labor input.
Diminishing Returns: As more labor is applied to a fixed amount of land, the average product of labor falls.
Malthusian Trap: Any increase in productivity leads to population growth, which eventually returns income to subsistence levels.
Labour input (number of farmers) | Grain output (kg) | Average product of labour (kg/farmer) |
|---|---|---|
200 | 171,000 | 855 |
800 | 504,000 | 630 |
1,600 | 778,000 | 486 |
3,000 | 946,000 | 315 |
The Market Forces of Supply and Demand
Measuring GDP and Economic Output
Gross Domestic Product (GDP) is a key measure of economic output, representing the market value of final goods and services produced in a country during a given period. Understanding how GDP is calculated and adjusted is crucial for comparing economies.
Nominal GDP: Calculated using current prices.
Real GDP: Adjusted for changes in prices to reflect the volume of production, using base year prices.
GDP per Capita: Average income per person, useful for comparing living standards.
Purchasing Power Parity (PPP): Adjusts GDP for differences in price levels across countries, allowing for more accurate international comparisons.
Externalities and Environmental Limits
GDP and Environmental Depletion
Traditional measures of GDP often ignore the depletion of natural resources and environmental impacts, which can lead to misleading assessments of living standards and economic growth.
Resource Depletion: Adjusting GDP for the depletion of resources provides a more accurate measure of sustainable prosperity.
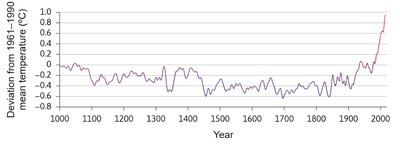
Climate Change: The use of fossil fuels has led to significant increases in CO2 emissions and global temperatures, as shown by 'hockey stick' graphs.
Income Inequality and Poverty
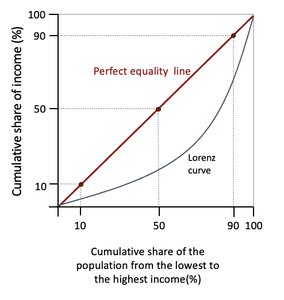
Measuring Inequality: Gini Coefficient and Lorenz Curve
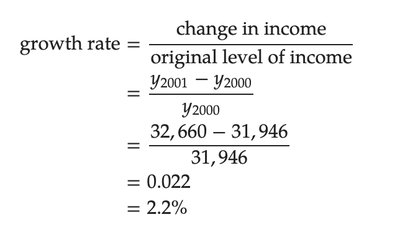
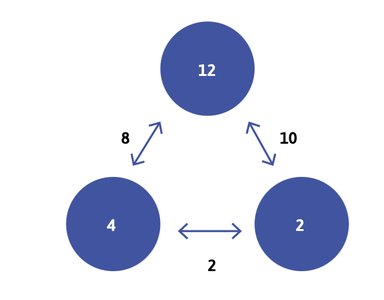
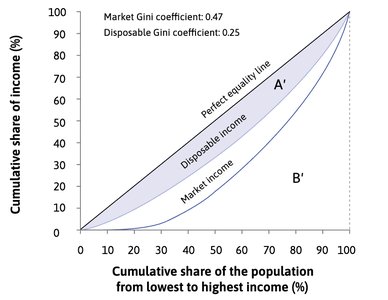
Economists use the Gini coefficient and Lorenz curve to measure and visualize income inequality within and between countries.
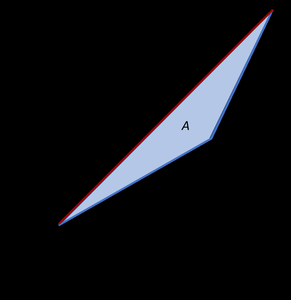
Gini Coefficient: A numerical measure of inequality, ranging from 0 (perfect equality) to 1 (extreme inequality).
Lorenz Curve: Graphically represents the distribution of income or wealth, showing the cumulative share of income received by the population.
Calculation:
Example: For incomes 12, 4, 2: average difference = 6.67, average income = 6, Gini = 0.56.
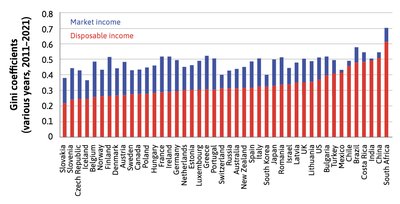
Comparing Inequality Across Countries
Gini coefficients and Lorenz curves allow for comparisons of income inequality across nations, highlighting the impact of redistributive policies.
Market Income vs Disposable Income: Redistribution through taxes and transfers reduces inequality.
International Comparisons: Countries vary widely in their Gini coefficients, reflecting differences in policy and economic structure.
Institutions and Economic Transformation
Capitalist Revolution and Structural Change
The escape from the Malthusian trap was enabled by continuous technological change and the development of capitalist institutions, which shifted the production function upward and transformed economic structures.
Capitalism: An economic system combining centralization (firms) and decentralization (markets), with private property as a foundation.
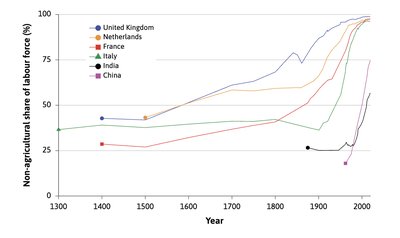
Structural Transformation: Shift from agriculture to manufacturing and services, with a growing share of the labor force in non-agricultural sectors.
Lewis Dual Economy Model: Describes the transition from a subsistence sector to a modern capitalist sector, driven by technological innovation and higher productivity.
Summary and Way Forward
For centuries, living standards remained static due to diminishing returns in agriculture, as explained by the Malthusian model. The industrial revolution and continuous technological change led to sustained improvements in living standards, supported by effective institutions and state policies. Understanding these foundational concepts is essential for further study in microeconomics, including incentives, market forces, and the impact of technological change.
