 Back
BackMicroeconomics Study Guide: Prosperity, Inequality, and Planetary Limits
Study Guide - Smart Notes
 Tailored notes based on your materials, expanded with key definitions, examples, and context.
Basic Principles of Economics
Prosperity, Inequality, and Planetary Limits
This section introduces foundational concepts in economics, focusing on the historical evolution of living standards, the measurement of economic output, and the role of institutions and the environment. It provides context for understanding how microeconomic forces shape prosperity and inequality.
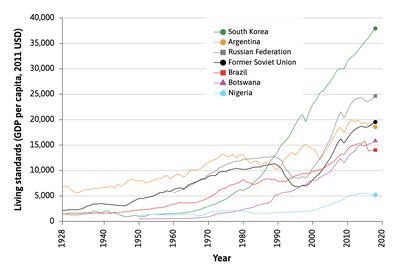
Living Standards: Historically, living standards remained low and stable for centuries, but have risen sharply in the past two hundred years due to technological change and industrialization.
Economic Theories: Theories such as the Malthusian trap explain periods of stagnation, while others address the rapid growth associated with the Industrial Revolution.
Role of the State: Effective states guide market activity, establish and enforce laws, and promote development. The contrast between South Korea and Nigeria illustrates the impact of state effectiveness on economic growth.
Institutions: Private property, markets, and firms are essential for sustained economic growth and the capitalist revolution.
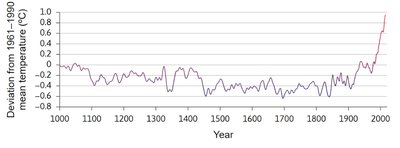
Planetary Limits: Economic growth must consider environmental constraints, such as resource depletion and climate change.
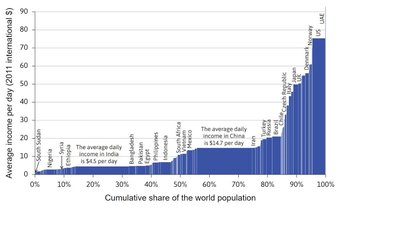
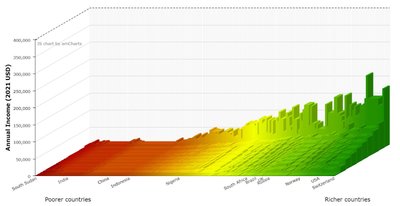
Income Inequality: Differences in living standards exist both between and within countries, shaped by economic and institutional factors.
Reading and Understanding Graphs
Graphical Representation of Economic Data
Graphs are essential tools in economics for visualizing trends, comparisons, and relationships. They help students interpret changes in living standards, income distribution, and environmental impacts.
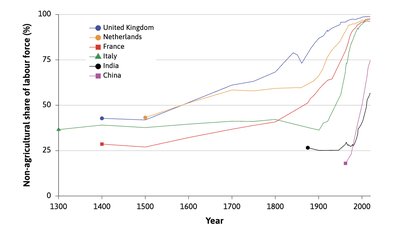
Time Series Graphs: Used to show changes in GDP per capita over time across countries.
Bar and 3D Graphs: Illustrate income distribution and inequality among countries and populations.
Environmental Data: Graphs can show deviations in global temperature, highlighting the impact of economic activity on the environment.
Introductory Economic Models
The Malthusian Model and the Capitalist Revolution
Economic models provide simplified representations of reality to explain and predict economic phenomena. The Malthusian model explains stagnation in living standards, while the capitalist model accounts for sustained growth.
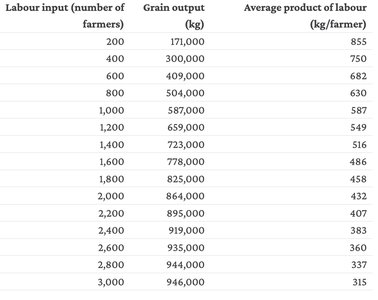
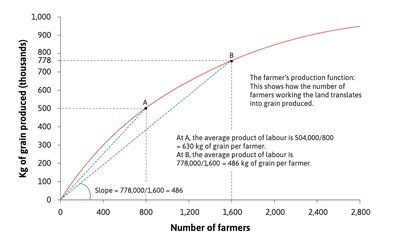
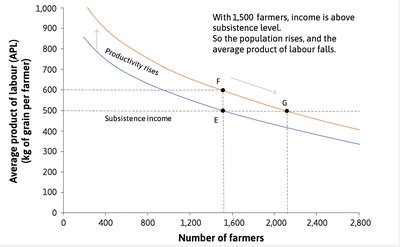
Malthusian Model: Suggests that increases in population lead to diminishing returns on fixed land, resulting in subsistence-level incomes.
Production Function: , where is output (grain) and is labor input.
Capitalist Revolution: Continuous technological change shifts the production function upward, enabling higher living standards.
Lewis Dual Economy Model: Describes the transition from subsistence agriculture to a modern capitalist sector, increasing productivity and income.
The Market Forces of Supply and Demand
GDP Measurement and Purchasing Power Parity (PPP)
Supply and demand determine the market value of goods and services, which is measured by GDP. PPP adjusts GDP for international price differences, enabling meaningful comparisons across countries.
Gross Domestic Product (GDP): The market value of final goods and services produced in a country during a given period.
Nominal GDP: Calculated using current prices; may be affected by inflation.
Real GDP: Adjusted for price changes using a base year; reflects actual output.
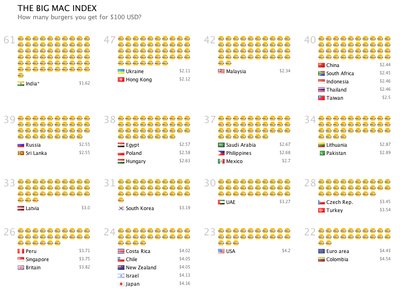
Purchasing Power Parity (PPP): Adjusts GDP to account for differences in price levels between countries, especially for non-traded goods.
Example: The Big Mac Index compares the price of hamburgers across countries to illustrate PPP adjustments.
Elasticity
GDP Growth Rate Calculation
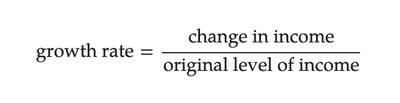
Elasticity measures responsiveness in economics. The growth rate of GDP is a key indicator of economic performance, calculated as the percentage change in income over time.
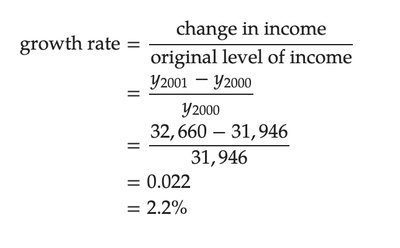
Growth Rate Formula:
Example Calculation: If GDP per capita increases from to , the growth rate is
Income Inequality and Poverty
Measuring Inequality: Gini Coefficient and Lorenz Curve
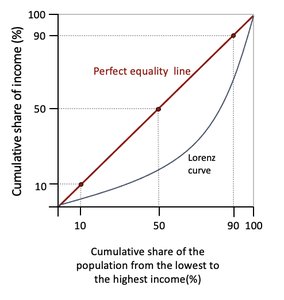
Income inequality is a central concern in microeconomics. Economists use the Gini coefficient and Lorenz curve to quantify and visualize inequality within and between countries.
Gini Coefficient: A numerical measure of inequality, ranging from 0 (perfect equality) to 1 (extreme inequality).
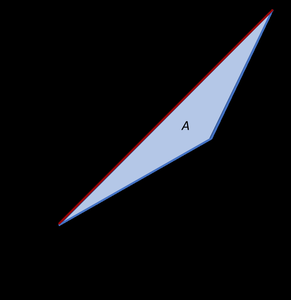
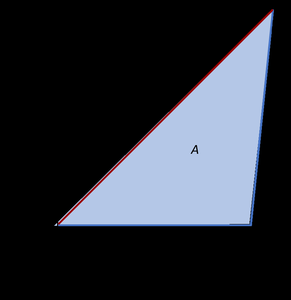
Calculation:
Lorenz Curve: Graphically represents the cumulative share of income received by the population, compared to perfect equality.
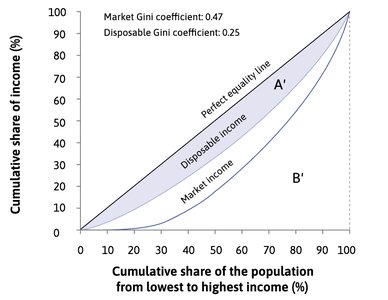
Redistributive Policies: Government interventions, such as taxes and transfers, can reduce inequality, as seen in the Netherlands.
International Comparisons: Gini coefficients vary across countries, reflecting differences in market income and redistributive policies.
Additional info:
Some context and explanations were inferred to ensure completeness and academic quality.
Images were included only when directly relevant to the adjacent paragraph, as per instructions.
