 Back
BackMicroeconomics Study Notes: Demand, Market Demand, and Demand Shifts
Study Guide - Smart Notes
 Tailored notes based on your materials, expanded with key definitions, examples, and context.
Market Demand: Principles and Applications
Individual Demand
The concept of individual demand describes how much of a good a single consumer is willing to buy at various prices, holding all other factors constant. The individual demand curve is downward-sloping, reflecting the law of demand: as price decreases, quantity demanded increases.
Marginal Benefit: The additional satisfaction or utility a consumer receives from consuming one more unit of a good.
Rational Rule for Buyers: Buy more of an item if its marginal benefit is greater than or equal to its price.
Diminishing Marginal Benefit: Each additional unit consumed yields less additional benefit than the previous one.
Example: If James is willing to pay $7 for his first Boba tea, $6 for the second, and $5 for the third, his marginal benefit decreases with each additional tea.
Key Equation:
Market Demand
Market demand aggregates the individual demands of all consumers in the market. It is calculated by summing the quantities demanded by each consumer at every price point (horizontal summation).
Extensive Margin: New consumers enter the market as price falls.
Intensive Margin: Existing consumers buy more as price falls.
Example: If James and Ali each buy 2 Boba teas at $6, market demand at $6 is 4 teas.
Market Demand Table Example:
Price ($) | James | Ali | Dre | Ying | Ben | Total Demand |
|---|---|---|---|---|---|---|
2 | 0 | 14 | 5 | 5 | 9 | 1135 |
3 | 7 | 6 | 4 | 3 | 7 | 744 |
4 | 5 | 5 | 3 | 1 | 5 | 408 |
5 | 3 | 4 | 2 | 0 | 3 | 222 |
6 | 2 | 3 | 1 | 0 | 1 | 116 |
7 | 1 | 2 | 0 | 0 | 0 | 93 |
Movement Along vs. Shifting the Demand Curve
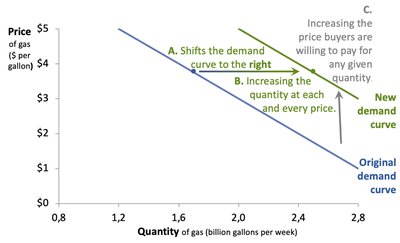
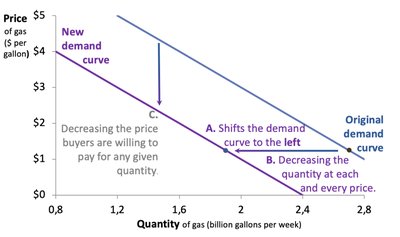
A movement along the demand curve occurs when the price of the good changes, resulting in a different quantity demanded according to the existing plan. A shift of the demand curve occurs when factors other than price change, altering the entire set of consumption plans.
Movement Along: Change in quantity demanded due to a change in price.
Shift: Change in demand due to factors like income, tastes, prices of other goods, expectations, network effects, or number of buyers.
Factors That Shift the Demand Curve
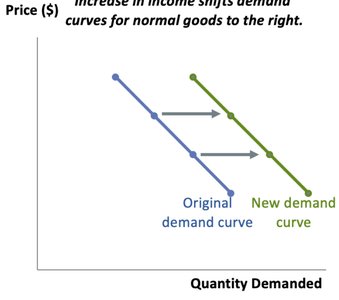
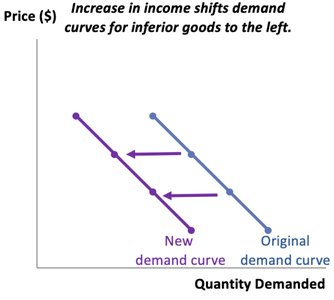
Income: Higher income increases demand for normal goods (shifts right), decreases demand for inferior goods (shifts left).
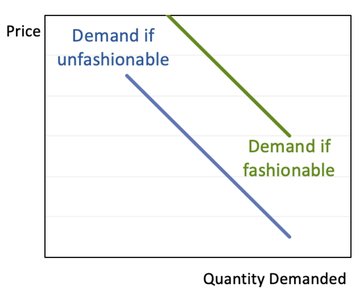
Tastes: Changes in consumer preferences can increase or decrease demand.
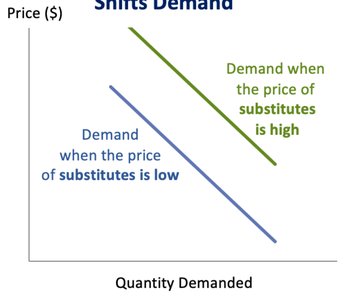
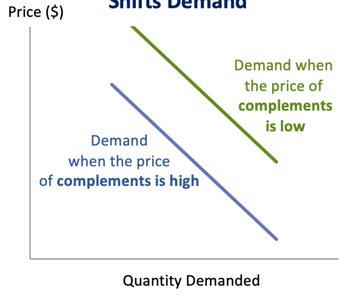
Prices of Other Goods: Substitutes and complements affect demand.
Expectations: Anticipated future prices can shift current demand.
Network and Congestion Effects: The value of a good may depend on how many others use it.
Number and Type of Buyers: More buyers increase market demand.
Income Effects
Normal Goods: Demand increases as income rises.
Inferior Goods: Demand decreases as income rises.
Changing Tastes
Consumer preferences, trends, and advertising can shift demand curves. For example, fashionable goods see increased demand.
Prices of Other Goods
Substitute Goods: When the price of a substitute rises, demand for the good increases.
Complementary Goods: When the price of a complement rises, demand for the good decreases.
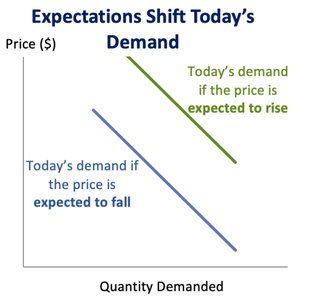
Expectations
If consumers expect prices to rise in the future, current demand increases. If prices are expected to fall, current demand decreases.
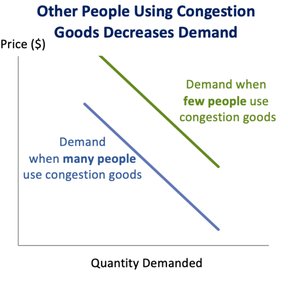
Network and Congestion Effects
Network Effects: Goods become more valuable as more people use them, increasing demand.
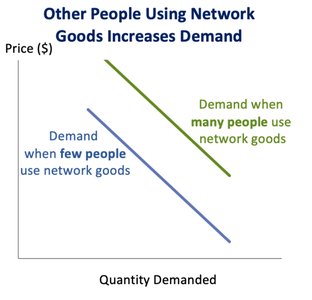
Congestion Effects: Goods become less valuable as more people use them, decreasing demand.
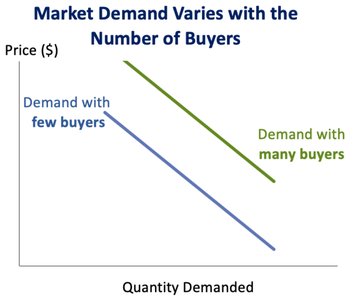
Number and Type of Buyers
Market demand increases as the number of buyers increases.
Practice: Applying Demand Concepts
Individual Demand Example: Cookies
Kate's demand for cookies at different prices illustrates the marginal benefit principle. If the price is $5, she buys one; at $4, she buys two; at $3, she buys three. If cookies cost $4, she buys two, since the marginal benefit of the third cookie ($3) is less than the price.
Marginal Benefit of first cookie: $5
Marginal Benefit of second cookie: $4
Marginal Benefit of third cookie: $3
Marginal Cost: $4
Decision: Buy as long as MB ≥ P; Kate buys two cookies.
Market Demand Example: Cookies
Market demand is calculated by summing individual demands at each price. For example, if Kate, John, Sarah, and Maria's demands at $5 are 1, 2, 4, and 3 respectively, market demand is 10.
Price ($) | Kate | John | Sarah | Maria | Market Demand |
|---|---|---|---|---|---|
2 | 10 | 5 | 12 | 7 | 34 |
3 | 4 | 8 | 5 | 3 | 20 |
4 | 3 | 6 | 4 | 5 | 15 |
5 | 2 | 4 | 3 | 6 | 10 |
6 | 1 | 2 | 4 | 3 | 6 |
7 | 0 | 1 | 3 | 2 | 3 |
8 | 0 | 0 | 2 | 1 | 1 |
Intensive vs. Extensive Margin Responses
Intensive Margin: Existing buyers purchase more as price falls.
Extensive Margin: New buyers enter the market as price falls.
Example: If the price falls from $7 to $6, Sarah and Maria buy more (intensive), and John starts buying (extensive).
Scenarios Affecting Market Demand
Buyer Leaves Market: Market demand curve shifts left.
Price Change: Movement along the demand curve.
Expectations of Future Price Increase: If tomatoes can be stored, demand shifts right today; if not, no shift occurs.
Summary Table: Factors Shifting Demand
Factor | Effect on Demand |
|---|---|
Income (Normal Good) | Shifts right |
Income (Inferior Good) | Shifts left |
Tastes | Shifts right or left |
Price of Substitutes | Shifts right if substitute price rises |
Price of Complements | Shifts left if complement price rises |
Expectations | Shifts right if price expected to rise |
Network Effects | Shifts right as more people use |
Congestion Effects | Shifts left as more people use |
Number of Buyers | Shifts right as buyers increase |
Additional info: These notes expand on the original content by providing definitions, examples, and structured tables for clarity and completeness.
