 Back
BackMicroeconomics: The Market Forces of Supply and Demand
Study Guide - Smart Notes
 Tailored notes based on your materials, expanded with key definitions, examples, and context.
The Market Forces of Supply and Demand
Introduction to Markets
Markets are institutions or arrangements that enable buyers and sellers to interact and exchange goods and services. In microeconomics, understanding how markets function is fundamental to analyzing economic outcomes.
Market: Any structure that allows buyers and sellers to exchange any type of goods, services, and information.
Examples: Markets for coffee and bagels, running shoes, and airline travel.

Demand
Demand refers to the quantity of a good or service that consumers are willing and able to purchase at various prices during a given period of time.
Law of Demand: All else equal, as the price of a good increases, the quantity demanded decreases, and vice versa.
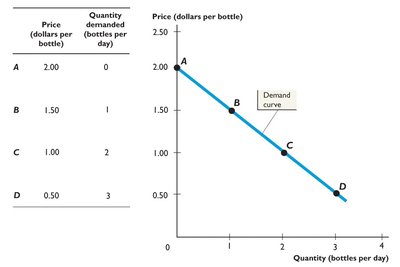
Demand Schedule: A table showing the relationship between the price of a good and the quantity demanded.
Demand Curve: A graphical representation of the demand schedule, typically downward sloping.
Individual and Market Demand
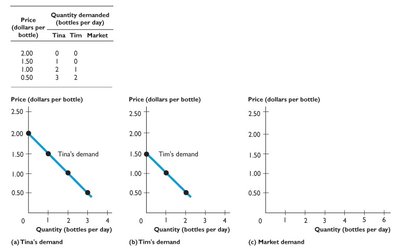
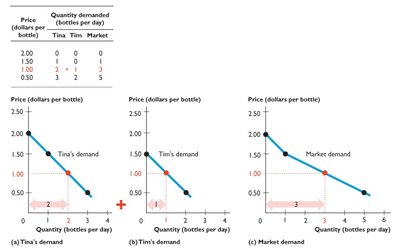
Market demand is the sum of all individual demands for a good or service.
Individual Demand: The demand of a single consumer.
Market Demand: The horizontal sum of all individual demand curves at each price.
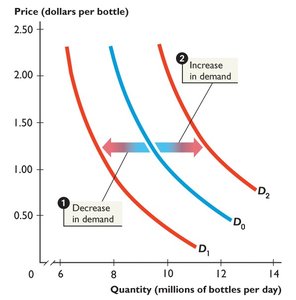
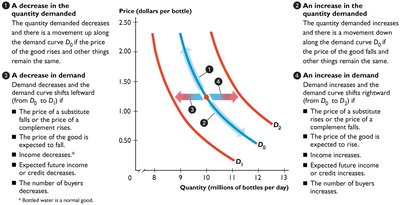
Shifts in Demand
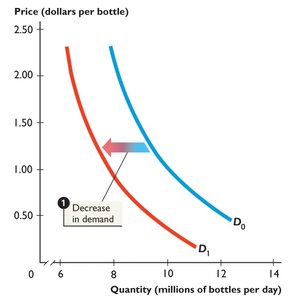
Changes in factors other than the price of the good itself cause the demand curve to shift.
Increase in Demand: The demand curve shifts to the right.
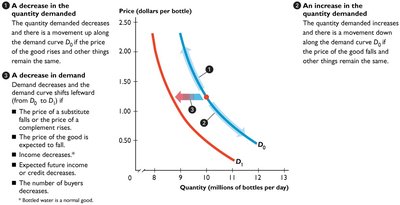
Decrease in Demand: The demand curve shifts to the left.
Determinants of Demand: Income, prices of related goods (substitutes and complements), tastes, expectations, and number of buyers.
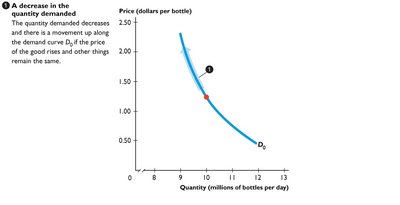
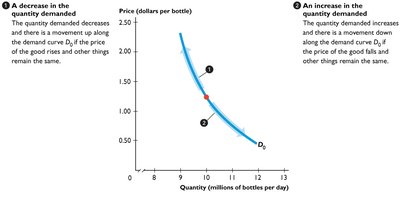
Movements Along vs. Shifts of the Demand Curve
A movement along the demand curve is caused by a change in the price of the good, while a shift of the demand curve is caused by changes in other determinants.
Movement Along: Change in quantity demanded due to a price change.
Shift: Change in demand due to other factors.
Supply
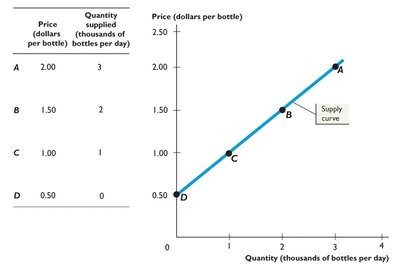
Supply refers to the quantity of a good or service that producers are willing and able to sell at various prices during a given period of time.
Law of Supply: All else equal, as the price of a good increases, the quantity supplied increases, and vice versa.
Supply Schedule: A table showing the relationship between the price of a good and the quantity supplied.
Supply Curve: A graphical representation of the supply schedule, typically upward sloping.
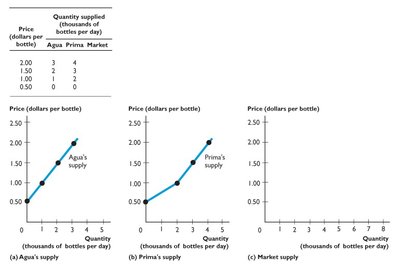
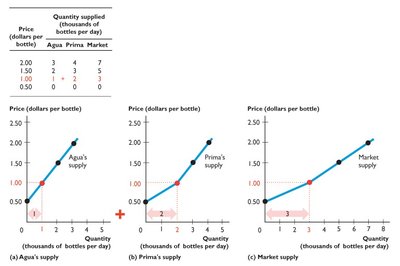
Individual and Market Supply
Market supply is the sum of all individual supplies for a good or service.
Individual Supply: The supply of a single producer.
Market Supply: The horizontal sum of all individual supply curves at each price.
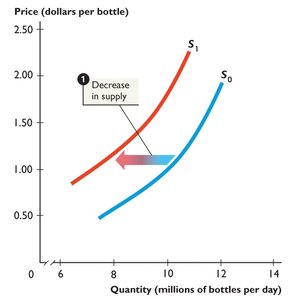
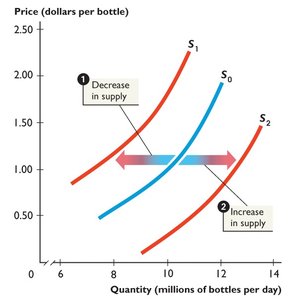
Shifts in Supply
Changes in factors other than the price of the good itself cause the supply curve to shift.
Increase in Supply: The supply curve shifts to the right.
Decrease in Supply: The supply curve shifts to the left.
Determinants of Supply: Input prices, technology, expectations, and number of sellers.
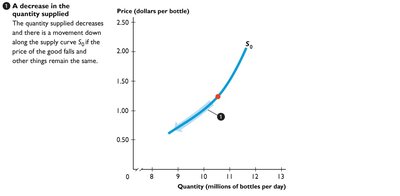
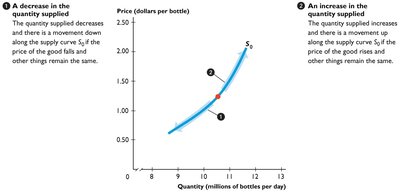
Movements Along vs. Shifts of the Supply Curve
A movement along the supply curve is caused by a change in the price of the good, while a shift of the supply curve is caused by changes in other determinants.
Movement Along: Change in quantity supplied due to a price change.
Shift: Change in supply due to other factors.
Summary Table: Determinants of Demand and Supply
Determinant | Effect on Demand | Effect on Supply |
|---|---|---|
Price of the Good | Movement along demand curve | Movement along supply curve |
Income | Shifts demand curve | No direct effect |
Prices of Related Goods | Shifts demand curve | Shifts supply curve (if input) |
Tastes/Preferences | Shifts demand curve | No direct effect |
Expectations | Shifts demand curve | Shifts supply curve |
Number of Buyers/Sellers | Shifts demand curve | Shifts supply curve |
Key Formulas
Demand Function (Linear):
Supply Function (Linear):
Applications and Examples
Example: The market for coffee involves both the supply of coffee beans (by farmers) and the demand for coffee (by consumers in cafes and at home). Changes in weather, technology, or consumer preferences can shift the supply or demand curves, affecting equilibrium price and quantity.

Additional info: The images and graphs provided illustrate the core concepts of demand and supply, including how individual and market curves are constructed and how shifts and movements are represented graphically. These are foundational to understanding market equilibrium and the effects of external changes on prices and quantities in microeconomics.
