 Back
BackMonopolistic Competition: The Competitive Model in a More Realistic Setting
Study Guide - Smart Notes
 Tailored notes based on your materials, expanded with key definitions, examples, and context.
Monopolistic Competition: The Competitive Model in a More Realistic Setting
Introduction to Monopolistic Competition
Monopolistic competition is a market structure characterized by many firms, low barriers to entry, and product differentiation. Firms compete by selling similar but not identical products, allowing for some degree of market power.
Product Differentiation: Each firm offers a product that is slightly different from its competitors, leading to a downward-sloping demand curve for each firm.
Low Barriers to Entry: New firms can enter the market easily, which affects long-run profitability.
Demand and Marginal Revenue in Monopolistic Competition
Demand Curve for a Monopolistically Competitive Firm
Unlike a perfectly competitive firm, which faces a horizontal demand curve, a monopolistically competitive firm faces a downward-sloping demand curve. This means the firm must lower its price to sell more units.
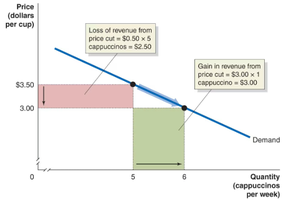
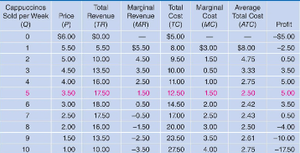
Example: If a coffeehouse increases the price of cappuccinos from $3.50 to $4.00, the quantity demanded decreases from 3,000 to 2,400 per week.
Marginal Revenue for a Firm with a Downward-Sloping Demand Curve
For a monopolistically competitive firm, the marginal revenue (MR) curve lies below the demand curve. This is because selling an additional unit requires lowering the price, which reduces revenue on all previous units sold at the higher price.
Output Effect: Selling one more unit increases revenue by the price of that unit.
Price Effect: Lowering the price reduces revenue on all units previously sold at the higher price.
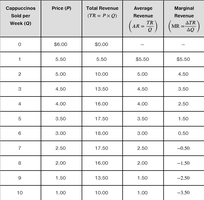
Marginal revenue can be calculated as:
For each additional unit sold, MR is less than the price due to the price effect.
Relationship Between Demand and Marginal Revenue
The marginal revenue curve becomes negative when the loss in revenue from lowering the price outweighs the gain from selling an additional unit.
Profit Maximization in the Short Run
How a Monopolistically Competitive Firm Maximizes Profit
All firms maximize profit by producing the quantity where marginal revenue equals marginal cost (MR = MC). The price is then determined by the demand curve at that quantity.
If MR > MC, the firm should increase output.
If MR < MC, the firm should decrease output.
Profit is maximized where MR = MC.
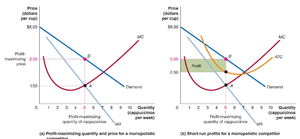
Profit can be calculated as:
For example, if the price is $3.50, average total cost is $2.50, and quantity is 5, then profit is $5.00.
Long-Run Adjustments and Zero Economic Profit
Entry and Exit of Firms
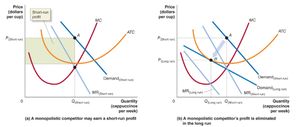
Economic profit in the short run attracts new entrants, shifting the demand curve for existing firms to the left and making it more elastic. In the long run, entry and exit of firms ensure that firms break even (zero economic profit).
In the long run, the demand curve is tangent to the average total cost curve, and price equals average total cost.
If firms are incurring losses, some will exit, shifting the demand curve for remaining firms to the right until losses are eliminated.
Summary Table: Short Run vs. Long Run
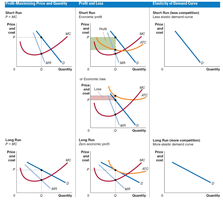
Profit-Maximizing Price and Quantity | Profit and Loss | Demand Curve |
|---|---|---|
Short Run: MR = MC | Short Run: Economic profit or loss possible | Short Run: Less elastic demand curve |
Long Run: MR = MC | Long Run: Zero economic profit (break-even) | Long Run: More elastic demand curve |
Comparing Monopolistic Competition and Perfect Competition
Key Differences
Both market structures result in zero economic profit in the long run.
Monopolistically competitive firms charge a price greater than marginal cost (P > MC) and do not produce at minimum average total cost.
Perfectly competitive firms are both allocatively and productively efficient; monopolistically competitive firms are not.
Monopolistically competitive firms have excess capacity.
Efficiency
Productive Efficiency: Achieved when goods are produced at the lowest possible cost (minimum ATC).
Allocative Efficiency: Achieved when the price equals marginal cost (P = MC).
Monopolistic competition does not achieve either form of efficiency.
Product Differentiation and Marketing
How Firms Differentiate Products
Firms use marketing to differentiate their products, which includes product design, advertising, and distribution. Differentiation allows firms to earn economic profit and defend it from competitors.
Brand Management: Actions taken to maintain product differentiation over time.
Advertising: Used to shift the demand curve to the right and make it more inelastic, increasing sales and allowing higher prices.
Trademark: Legal protection for a brand name.
What Makes a Firm Successful?
The most important factors for a firm's success are its ability to differentiate its product and/or produce at a lower average cost than competitors. Continuous innovation in product differentiation and cost reduction is key to maintaining economic profit.
