 Back
BackMonopoly and Price Discrimination: Microeconomics Study Guide
Study Guide - Smart Notes
 Tailored notes based on your materials, expanded with key definitions, examples, and context.
The Monopolistic Firm
Definition and Characteristics
A monopoly is a market structure where a single firm is the sole seller of a product with no close substitutes. The monopolist is a price-maker, meaning it can set the price for its product, unlike firms in perfect competition that are price-takers. Entry into the market is restricted by legal or natural barriers, such as patents, government regulation, or prohibitively high entry costs.
Monopoly Power: Varies by country; defined by market share (e.g., 25% in the UK, 50% in Israel, 70% in the US).
Key Assumptions: One producer, no close substitutes, barriers to entry, price-maker, profit maximization.
Negative Connotation: Monopolies are often associated with higher prices and lower quantities supplied, reducing consumer surplus.
Comparison to Perfect Competition
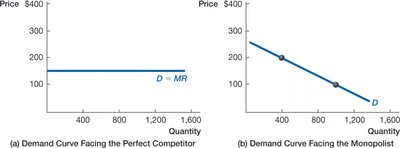
In perfect competition, firms face a perfectly elastic demand curve and cannot influence the market price. In contrast, a monopolist faces the entire market demand, which is downward sloping.
Perfect Competition: Many firms, homogeneous goods, free entry/exit, price-takers.
Monopoly: Single firm, no close substitutes, barriers to entry, price-maker.
Profit Maximization under Uniform Pricing
Marginal Revenue and Demand
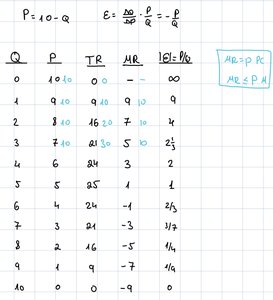
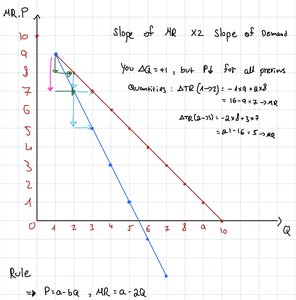
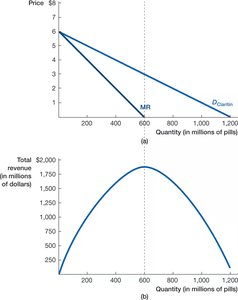
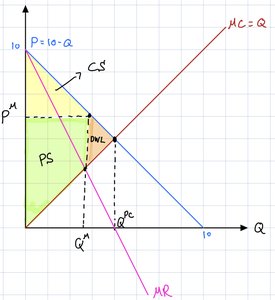
The monopolist's marginal revenue (MR) is not equal to price (P) because increasing quantity requires lowering the price for all units sold. The MR curve lies below the demand curve and has twice the slope when demand is linear.
Marginal Revenue Formula: For linear demand , .
MR ≤ P: Marginal revenue is always less than or equal to price.
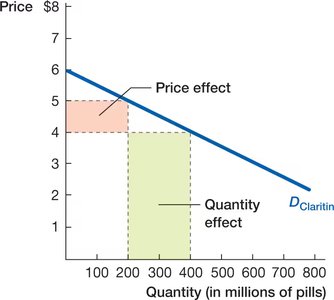
Trade-off: Increasing quantity increases revenue from more units (quantity effect) but decreases revenue per unit (price effect).
Profit Maximization Rule
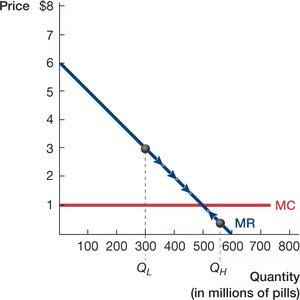
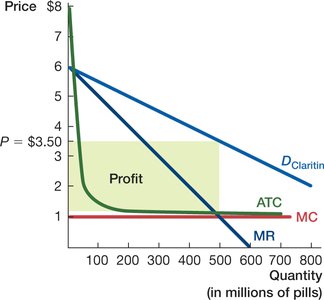
The monopolist maximizes profit by producing the quantity where marginal revenue equals marginal cost (MR = MC). The price is then set from the demand curve at this quantity.
Profit Formula:
Mark-up Percentage:
Equilibrium: MR = MC determines quantity; price is found from demand curve.
Welfare Analysis and Natural Monopoly
Social Surplus and Deadweight Loss
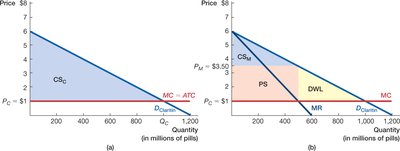
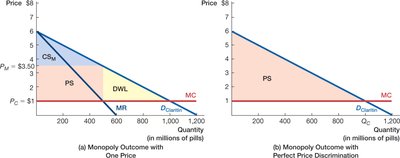
Monopoly leads to underproduction compared to perfect competition, resulting in deadweight loss (DWL). In perfect competition, social surplus is maximized, and quantity is set where marginal social benefit equals marginal social cost.
Consumer Surplus (CS): Area above price and below demand curve.
Producer Surplus (PS): Area below price and above supply curve.
Deadweight Loss (DWL): Loss of social surplus due to monopoly underproduction.
Natural Monopoly
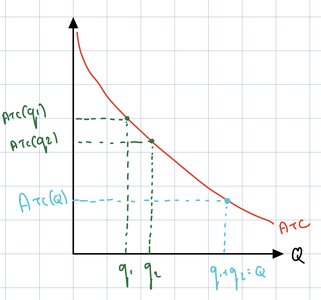
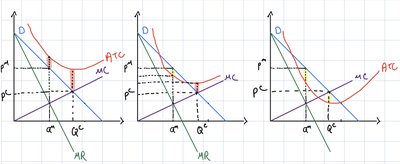
A natural monopoly occurs when high fixed costs make it more efficient for a single firm to supply the market. Average total cost (ATC) decreases as output increases, so splitting production among multiple firms increases total costs.
Justification: If ATC(q1) + ATC(q2) > ATC(Q), a single producer is more efficient.
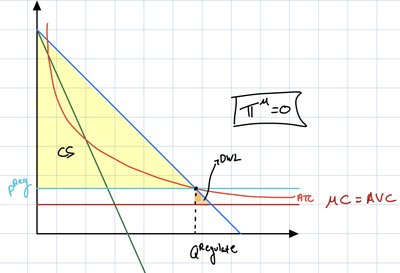
Government Intervention: May regulate prices or subsidize the monopoly to ensure service provision.
Profit Maximization with Price Discrimination
Types of Price Discrimination
Price discrimination occurs when a firm charges different prices to different customers for the same product, not based on cost differences. There are three main types:
First-Degree (Perfect) Price Discrimination: Each consumer is charged their maximum willingness to pay (WTP). Requires perfect information and no resale.
Second-Degree Price Discrimination: Prices vary based on purchase characteristics (e.g., quantity, quality, package). Consumers self-select into packages.
Third-Degree Price Discrimination: Prices vary by identifiable groups (e.g., students, seniors, geographic location).

Perfect Price Discrimination
Under perfect price discrimination, the monopolist captures all consumer surplus, maximizing social surplus and eliminating deadweight loss. However, this is rare due to information and enforcement challenges.
Efficiency: All units where WTP ≥ MC are sold.
Consumer Surplus: Reduced to zero; producer surplus equals total social surplus.
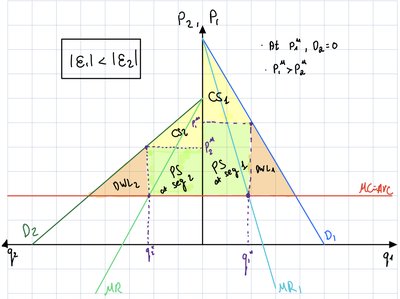
Third-Degree Price Discrimination (Market Segmentation)
Third-degree price discrimination divides consumers into segments based on observable characteristics. The monopolist sets different prices for each segment, depending on their demand elasticity.
Pricing Rule:
Inelastic Segment: Charged higher prices.
Elastic Segment: Charged lower prices.
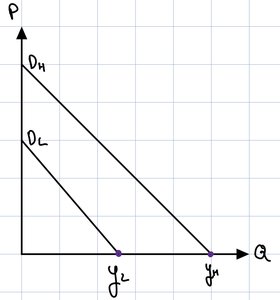
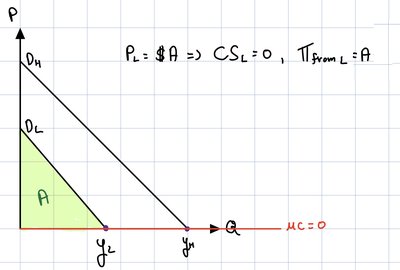
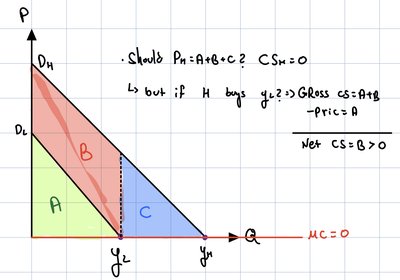
Second-Degree Price Discrimination (Menu Pricing)
Second-degree price discrimination involves offering different packages or quantities, allowing consumers to self-select based on their willingness to pay. The monopolist designs packages to extract surplus from different consumer types.
Examples: Economy vs. business tickets, data plans, bulk buying.
Menu Design: Packages are structured so that high WTP consumers choose higher-priced options.
Screening: Prices are set to make consumers just indifferent between packages, maximizing profit extraction.

Summary Table: Monopoly vs. Perfect Competition
Feature | Perfect Competition | Monopoly |
|---|---|---|
Number of Firms | Many | One |
Market Power | None (price-taker) | High (price-maker) |
Entry Barriers | None | High |
Product | Homogeneous | No close substitutes |
Profit Maximization | ||
Consumer Surplus | High | Lower |
Deadweight Loss | None | Present |
Key Formulas
Marginal Revenue (Linear Demand):
Profit:
Mark-up Percentage:
Elasticity:
Conclusion
Monopoly and price discrimination are central topics in microeconomics, illustrating how market power affects pricing, output, and welfare. Understanding these concepts is essential for analyzing real-world markets and the impact of government regulation.
