 Back
BackOperations Management and Process Strategy: Study Notes for Microeconomics Students
Study Guide - Smart Notes
 Tailored notes based on your materials, expanded with key definitions, examples, and context.
Operations Management: Basic Principles
Inputs, Processes, Outputs, and Information Flows
Operations management involves the systematic design, direction, and control of processes that transform inputs into services and products for customers. The flow of information, materials, and services is managed to ensure efficiency and customer satisfaction.
Inputs: Resources such as materials, labor, and information.
Processes: Activities that transform inputs into outputs.
Outputs: Finished goods or services delivered to customers.
Information Flows: Communication between suppliers, operations, and customers.
Supply Chain Management synchronizes a firm's processes with those of its suppliers and customers to match the flow of materials, services, and information with customer demand.
Historical Evolution and Perspectives
The field evolved from rural economies to industrial economies, emphasizing specialization, assembly lines, and Just-In-Time (JIT) production.
Service and Manufacturing Processes
Goods vs. Services
Goods: Physical, durable, inventoried, low customer contact, capital intensive, quality easily measured.
Services: Intangible, perishable, cannot be inventoried, high customer contact, labor intensive, quality not easily measured.

Process Strategy
Major Decisions for Effective Processes
Process strategy is the pattern of decisions made in managing processes to achieve competitive priorities such as cost, quality, time, and flexibility.
Process Structure: Type of resources and their arrangement.
Customer Involvement: Extent of customer participation in the process.
Resource Flexibility: Ability of employees and equipment to handle various tasks.
Capital Intensity: Mix of equipment and human skills.
Process Structure in Services
Service processes differ by customer contact, customization, process divergence, and flow.
Customer Contact: Presence and involvement of the customer.
Customization: Degree to which services are tailored.
Process Divergence: Latitude in task performance.
Flow: Sequence of steps in the process.
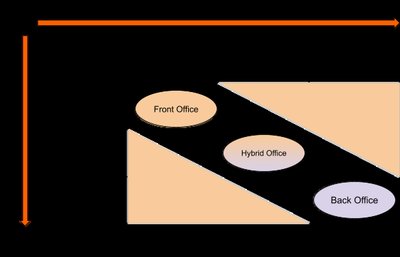
Service Process Structuring
Front Office: High customer contact, tailored services.
Hybrid Office: Moderate customer contact, some options.
Back Office: Low customer contact, standardized services.
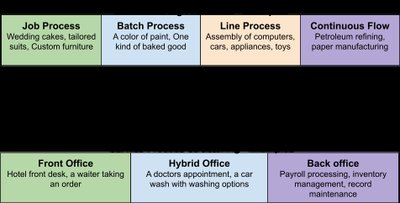
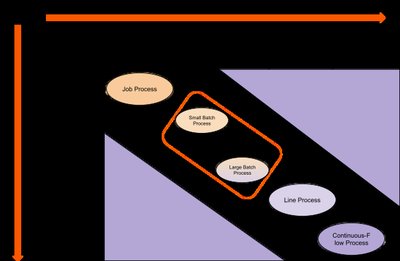
Process Structure in Manufacturing
Manufacturing processes are structured based on volume and customization.
Job Process: High customization, low volume.
Batch Process: Moderate volume, some customization.
Line Process: High volume, standardized products.
Continuous-Flow Process: Very high volume, highly standardized.
Production and Inventory Strategies
Design-to-Order: Unique products, no inventory.
Make-to-Order: Custom products, low volume, no inventory.
Assemble-to-Order: Mass customization, no inventory until order.
Make-to-Stock: Standardized products, inventory held for immediate delivery.
Process Strategy Decisions
Customer Involvement
Advantages: Increased value, better quality, faster delivery, flexibility, lower costs.
Disadvantages: Potential disruptions, challenging management, interpersonal skills required.
Resource Flexibility
Workforce: Cross-trained, reliable customer service.
Equipment: General-purpose (flexible, low volume), special-purpose (efficient, high volume).
Capital Intensity
Automation: Self-acting and self-regulating systems.
Fixed Automation: Efficient for high volume, low divergence.
Flexible Automation: Adaptable for various products.
Economies of Scope: Producing multiple products more cheaply together.
Process Improvement and Quality Management
Costs of Quality
Prevention Costs: Preventing defects before they happen.
Appraisal Costs: Assessing process performance.
Internal Failure Costs: Defects found during production.
External Failure Costs: Defects found after delivery to customer.
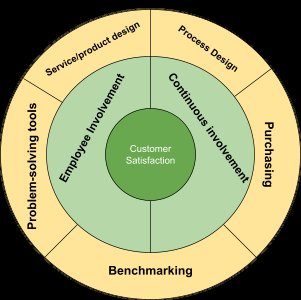
Total Quality Management (TQM) and Six Sigma
TQM and Six Sigma are philosophies and systems for achieving high levels of process performance and quality by focusing on customer satisfaction, employee involvement, and continuous improvement.
Six Sigma Methodology
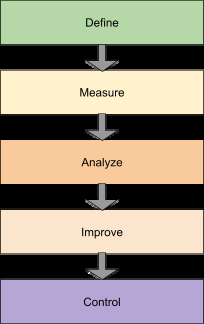
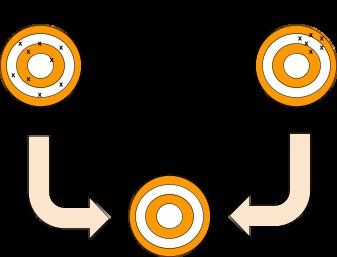
Six Sigma aims for extremely low defect rates by centering processes and reducing variability. The DMAIC cycle (Define, Measure, Analyze, Improve, Control) is used for process improvement.
Statistical Process Control (SPC)
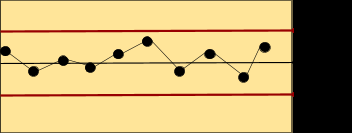
SPC uses statistical techniques to monitor and control processes, ensuring outputs meet customer requirements. Variation in outputs is categorized as common (random) or assignable (identifiable).
Control Chart: Time-ordered diagram to detect abnormal variations.
Process Capability: Ability to meet design specifications.
Nominal Value: Target specification.
Tolerance: Allowable deviation from nominal value.
International Quality Standards
ISO 9001:2015: Documentation standards for quality management.
Malcolm Baldridge Performance Excellence Program: Government award for quality strategies and achievements.
Data Analysis Tools for Process Improvement
Checklists: Identify process failures.
Histograms and Bar Charts: Visualize data distribution.
Pareto Charts: Highlight major causes of problems.
Scatter Diagrams: Show relationships between variables.
Cause and Effect Diagrams (Fishbone): Identify root causes of problems.
Benchmarking and Continuous Improvement
Benchmarking: Comparing processes against industry leaders.
Continuous Improvement: Ongoing efforts to enhance processes (Kaizen).
Learning Curve: Efficiency improves with repeated practice.
Process Reengineering: Radical redesign for dramatic performance improvement.
