 Back
BackProduction Possibilities, Opportunity Cost, and Market Dynamics: Microeconomics Study Guidance
Study Guide - Smart Notes
 Tailored notes based on your materials, expanded with key definitions, examples, and context.
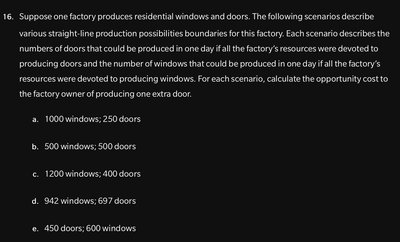
Q1. Suppose one factory produces residential windows and doors. For each scenario below, calculate the opportunity cost to the factory owner of producing one extra door:
a. 1000 windows and 250 doors
b. 500 windows and 500 doors
c. 1200 windows and 400 doors
d. 942 windows and 697 doors
e. 450 windows and 600 doors
Background
Topic: Production Possibility Frontier (PPF) and Opportunity Cost
This question tests your understanding of how to calculate opportunity cost using production possibility data. The opportunity cost measures what must be given up to produce more of another good, and is a fundamental concept in microeconomics.
Key Terms and Formulas
Production Possibility Frontier (PPF): Shows the maximum possible output combinations of two goods that can be produced with available resources.
Opportunity Cost: The value of the next best alternative foregone when a choice is made.
Key formula:
Step-by-Step Guidance
For each scenario, identify the maximum number of windows and doors that can be produced if all resources are devoted to each good.
Use the formula above to calculate the opportunity cost of producing one extra door in terms of windows forgone.
Set up the calculation for each scenario, e.g., for part (a): .
Interpret what the result means: For every additional door produced, how many windows must be sacrificed?
Try solving on your own before revealing the answer!
Final Answer:
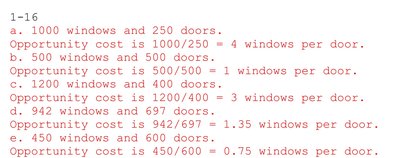
a. 4 windows per door
b. 1 window per door
c. 3 windows per door
d. 1.35 windows per door
e. 0.75 windows per door
Each calculation shows how many windows must be given up to produce one more door, illustrating the concept of opportunity cost along a straight-line PPF.
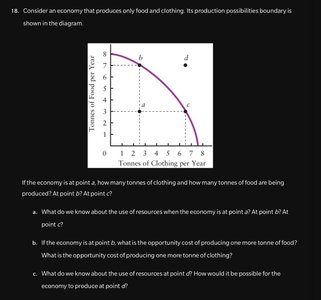
Q2. Consider an economy that produces only food and clothing. Its production possibilities boundary is shown in the diagram. Answer the following:
a. If the economy is at point a, b, or c, how many tonnes of clothing and food are produced?
b. What do we know about the use of resources at each point?
c. What is the opportunity cost of producing one more tonne of food or clothing at point b?
d. What do we know about the use of resources at point d? How could the economy reach point d?
Background
Topic: Production Possibility Curve (PPC), Resource Allocation, and Opportunity Cost
This question tests your ability to interpret points on a PPC, understand resource employment, and calculate opportunity costs.
Key Terms and Formulas
PPC: Shows all possible combinations of two goods that can be produced given resources and technology.
Opportunity Cost: The amount of one good that must be given up to produce more of another.
Key formula:
Step-by-Step Guidance
Read the coordinates for points a, b, and c from the diagram to determine the quantities produced.
Assess whether resources are fully employed at each point (on the curve vs. inside the curve).
Calculate the opportunity cost at point b using the slope of the PPC between relevant points.
Discuss why point d is unattainable and what would be needed to reach it (e.g., more resources or better technology).
Try solving on your own before revealing the answer!
Final Answer:
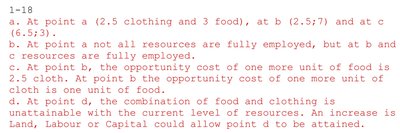
a. At point a: 2.5 clothing, 3 food; at b: 2.5 clothing, 7 food; at c: 6.5 clothing, 3 food
b. At point a, not all resources are fully employed; at b and c, resources are fully employed
c. At point b, opportunity cost of one more unit of food is 2.5 cloth; opportunity cost of one more unit of cloth is one unit of food
d. Point d is unattainable with current resources; more land, labor, or capital would be needed
These answers show how to interpret the PPC and opportunity cost, and how resource constraints affect attainable production points.
Q3. For each scenario, describe how the production possibilities curve (PPC) would shift:
a. Civil war destroys most infrastructure
b. New technology doubles food production ability
c. Earthquake destroys many clothes factories
Background
Topic: Shifts in Production Possibility Curve (PPC)
This question tests your understanding of how changes in resources or technology affect the PPC.
Key Terms and Formulas
PPC Shift: Outward shift means increased production capacity; inward shift means decreased capacity.
Resource destruction: Reduces production possibilities.
Technological improvement: Increases production possibilities for affected goods.
Step-by-Step Guidance
For each event, identify which good(s) are affected and whether the change is positive or negative.
Describe how the PPC would shift: inward for destruction, outward for technological improvement.
Explain whether the shift affects both axes or only one, depending on which resource or technology is impacted.
Try solving on your own before revealing the answer!
Final Answer:
a. Civil war: PPC shifts inward for both goods
b. New food technology: PPC shifts outward only along the food axis
c. Earthquake: PPC shifts inward only along the clothing axis
Each scenario illustrates how the PPC responds to changes in resources or technology, affecting the economy's production capacity.
