 Back
BackSellers and Incentives in Perfect Competition: Microeconomics Study Guide
Study Guide - Smart Notes
 Tailored notes based on your materials, expanded with key definitions, examples, and context.
Chapter 6: Sellers and Incentives
Learning Objectives
Understand the role of sellers in perfectly competitive markets.
Analyze the seller’s problem: production, costs, and revenues.
Connect the seller’s problem to the supply curve.
Define and measure producer surplus.
Distinguish between short-run and long-run decisions.
Explain long-run competitive equilibrium in markets.
Key Ideas
The seller’s problem consists of three parts: production, costs, and revenues.
Optimizing sellers make decisions at the margin.
The supply curve reflects willingness to sell at various price levels.
Producer surplus is the difference between market price and the marginal cost curve.
Sellers enter and exit markets based on profit opportunities.
Sellers in a Perfectly Competitive Market
Conditions of Perfect Competition
Perfect competition is characterized by several key conditions that ensure no single buyer or seller can influence the market price.
No buyer or seller is big enough to influence the market price: With many consumers and producers, individual actions do not affect the overall price.
Identical goods: Sellers produce goods that are indistinguishable from one another, preventing price manipulation through product differentiation.
Free entry and exit: Sellers can enter profitable markets or exit unprofitable ones, affecting market supply and price.
The Seller’s Problem
Three Fundamental Questions
Sellers aim to maximize profit by solving three interconnected problems:
How to make the product: Transforming inputs into outputs through production.
What is the cost of making the product?: Calculating costs associated with production.
How much can the seller get for the product in the market?: Determining potential revenue.
Production Concepts
Physical capital: Goods such as machines and buildings used in production.
Short run: Period when some inputs cannot be changed (e.g., limited by current equipment).
Long run: Period when all inputs can be changed (e.g., can buy new equipment or expand facilities).
Variable factor of production: Inputs that can be changed in a given period and vary with output.
Fixed factor of production: Inputs that cannot be changed in the short run and remain constant regardless of output.
Marginal Product and Diminishing Returns
The marginal product is the change in total output from using one more unit of input. Initially, marginal product increases due to specialization, but eventually falls due to the law of diminishing returns. Excessive input can even lead to negative marginal product.
Specialization: Early workers increase efficiency.
Diminishing returns: Additional workers contribute less output.
Negative marginal product: Too many workers can reduce total output.

Cost Concepts
Costs are divided into variable and fixed components. In the short run:
Variable Cost (VC): Costs that change with output.
Fixed Cost (FC): Costs that remain constant regardless of output (also called overhead).
Total Cost (TC):
Average Total Cost (ATC):
Average Variable Cost (AVC):
Average Fixed Cost (AFC):
Marginal Cost (MC):

Revenue and Profit
Total Revenue (TR):
Profit:
Marginal Revenue (MR): In perfect competition,

Accounting vs. Economic Profit
Accounting profit:
Economic profit:
Opportunity (implicit) costs: Economic profits include implicit costs, such as foregone alternatives.
Profit Maximization Rule
Firms maximize profit by producing where marginal revenue equals marginal cost:
In perfect competition,
Profit calculation:

From the Seller’s Problem to the Supply Curve
Supply Curve and Marginal Cost
The supply curve is derived from the marginal cost curve. Firms supply goods only when the price is above a certain threshold.
At prices below average variable cost (AVC), firms shut down in the short run.
Shutdown rule: If , shut down; if , continue production.
Price Elasticity of Supply
Elasticity measures how responsive quantity supplied is to price changes.
Elastic supply:
Inelastic supply:
Unit-elastic supply:
Elasticity increases with inventory, ease of hiring, and longer time horizons.
Producer Surplus
Definition and Measurement
Producer surplus is the difference between the price a firm receives and the minimum price it would accept (its marginal cost).
Graphically, it is the area below the market price and above the supply (MC) curve.
For a triangle:

From the Short Run to the Long Run
Short Run vs. Long Run
Short run: Some factors are fixed; output changes by adjusting labor.
Long run: All factors are variable; output can be changed by adjusting any input.
Economies of Scale
Economies of scale: ATC falls as output increases; large set-up costs and specialization drive this.
Constant returns to scale: ATC remains unchanged as output increases.
Diseconomies of scale: ATC rises as output increases; often due to excessive management layers.
From the Firm to the Market: Long-Run Competitive Equilibrium
Entry and Exit
In the long run, firms can freely enter or exit the industry, responding to profit opportunities.
Free entry ensures that economic profits are competed away in the long run.
Market equilibrium is achieved when firms earn zero economic profit (accounting profit may still be positive).
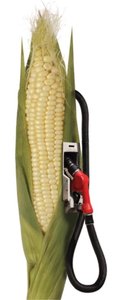
Evidence-Based Economics: Ethanol Subsidy Example
Impact of Subsidies
Subsidies increase short-run profits, attracting new entrants. As more firms enter, market supply increases, driving down prices and profits.
Long-run effect: Number of firms increases, profits return to equilibrium.
Subsidy reduction lowers average total cost, affecting entry/exit decisions.
Tables
Production Data for The Wisconsin Cheeseman
Main purpose: To illustrate the relationship between number of workers, output, and marginal product.
Number of Workers | Output per Day | Marginal Product |
|---|---|---|
0 | 0 | - |
1 | 100 | 100 |
2 | 207 | 107 |
3 | 321 | 114 |
4 | 444 | 123 |
5 | 558 | 114 |
6 | 664 | 106 |
7 | 762 | 98 |
8 | 854 | 92 |
9 | 939 | 85 |
10 | 1019 | 80 |
11 | 1092 | 73 |
12 | 1161 | 69 |
13 | 1225 | 64 |
14 | 1284 | 59 |
15 | 1339 | 55 |
16 | 1390 | 51 |
17 | 1438 | 48 |
38 | 1934 | 10 |
39 | 1834 | -100 |
Cost Concepts Table
Main purpose: To show how costs change with output and to calculate average and marginal costs.
Output | Variable Cost | Fixed Cost | Total Cost | ATC | AFC | AVC | MC |
|---|---|---|---|---|---|---|---|
100 | $72 | $200 | $272 | $2.72 | $2.00 | $0.72 | $0.72 |
207 | $144 | $200 | $344 | $1.66 | $0.97 | $0.70 | $0.67 |
321 | $216 | $200 | $416 | $1.29 | $0.62 | $0.67 | $0.63 |
444 | $288 | $200 | $488 | $1.10 | $0.45 | $0.65 | $0.59 |
558 | $360 | $200 | $560 | $1.00 | $0.36 | $0.65 | $0.63 |
664 | $432 | $200 | $632 | $0.95 | $0.30 | $0.65 | $0.68 |
762 | $504 | $200 | $704 | $0.92 | $0.26 | $0.66 | $0.73 |
854 | $576 | $200 | $776 | $0.91 | $0.23 | $0.67 | $0.79 |
Summary Table: Types of Returns to Scale
Type | ATC Behavior | Example | Reason |
|---|---|---|---|
Economies of Scale | Falls as output increases | Inputs double, output more than doubles | Large set-up costs, specialization |
Constant Returns to Scale | Unchanged as output increases | Inputs double, output doubles | All gains from specialization realized |
Diseconomies of Scale | Rises as output increases | Inputs double, output increases by less than double | Too much management |
Conclusion
This chapter provides a comprehensive overview of sellers’ incentives and decision-making in perfectly competitive markets. Understanding production, cost, and revenue concepts is essential for analyzing supply curves, producer surplus, and market equilibrium. The role of profit maximization, elasticity, and long-run adjustments ensures efficient market outcomes and guides entry and exit decisions for firms.
