 Back
BackSupply and Demand: Foundations, Shocks, and Government Intervention
Study Guide - Smart Notes
 Tailored notes based on your materials, expanded with key definitions, examples, and context.
Supply and Demand
Introduction
The supply and demand model is a fundamental framework in microeconomics used to analyze how prices and quantities of goods and services are determined in competitive markets. This model explains the interaction between consumers and producers, and how external factors and government policies can influence market outcomes.
Quantity Demanded
The quantity demanded is the amount of a good that consumers are willing to buy at a given price, holding other factors constant. Economists focus on how a good’s own price affects the quantity demanded, analyzing changes while keeping other variables fixed.
Law of Demand: States that consumers demand more of a good if its price is lower, and less if its price is higher. Demand curves typically slope downward.
Movements vs. Shifts: Changes in price cause movements along the demand curve, while changes in other factors (income, tastes, prices of related goods) cause the demand curve to shift.
Demand Shifters
Several factors other than price can shift the demand curve:
Income: Higher income increases demand for normal goods and decreases demand for inferior goods.
Prices of Related Goods: Substitutes (increase in price of one increases demand for the other) and complements (increase in price of one decreases demand for the other).
Tastes: Changes in consumer preferences affect demand.
Information: Knowledge about a good’s effects can alter demand.
Government Rules: Regulations, taxes, or subsidies can shift demand.
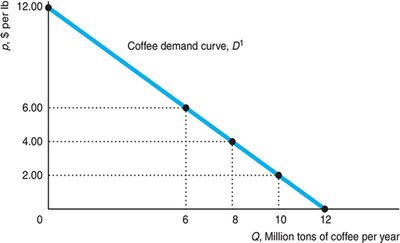
The Demand Curve
A demand curve shows the quantity demanded at each possible price, holding other factors constant. The vertical axis measures price, and the horizontal axis measures quantity.
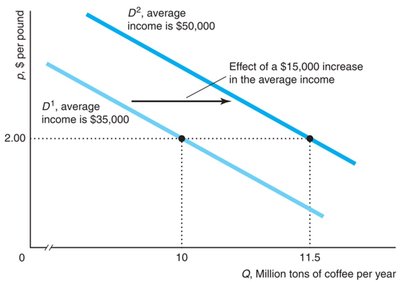
Effects of Income on Demand
When average income increases, the demand curve shifts to the right, indicating higher quantity demanded at each price.
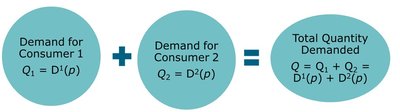
Market/Total Demand
The total market demand is the sum of individual demands at each price. For two consumers:
Q = Q1 + Q2 = D1(p) + D2(p)
Quantity Supplied
The quantity supplied is the amount of a good that firms want to sell at a given price, holding other factors constant. Firms typically supply more at higher prices.
Other Factors: Costs of production, technological change, and government regulations affect supply.
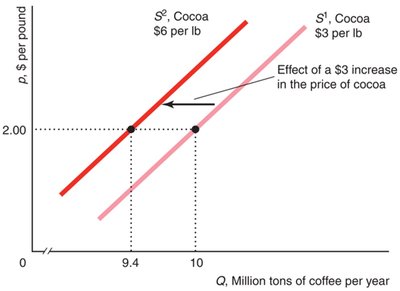
Supply Shifters
Changes in input prices, technology, or government policies can shift the supply curve.
Example: If the price of cocoa rises, some coffee producers switch to cocoa, reducing coffee supply and shifting the supply curve left.
Market/Total Supply
The total supply curve is the sum of individual firms’ supply at each price. For two producers:
Q = Q1 + Q2 = S1(p) + S2(p)

Market Equilibrium
Market equilibrium occurs where the supply and demand curves intersect, determining the equilibrium price and quantity. At this point, quantity demanded equals quantity supplied.
Equilibrium Price: The price at which consumers can buy as much as they want and firms can sell as much as they want.
Mathematical Solution: Set Qd = Qs and solve for price and quantity.
Equilibrium: ,
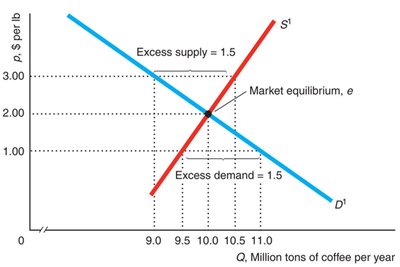
Excess Demand and Excess Supply
If the market price is below equilibrium, there is excess demand; if above, excess supply. Market forces push the price toward equilibrium.
Market Shocks
Shocks to supply or demand (such as changes in income or input prices) shift the respective curves, leading to new equilibrium prices and quantities.
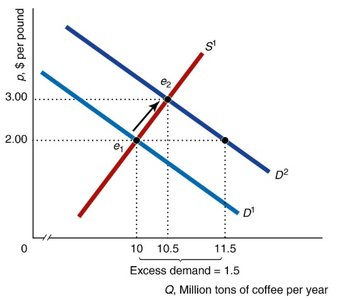
Shift in the Demand Curve
An increase in income shifts the demand curve right, causing excess demand at the original price and a new, higher equilibrium price.
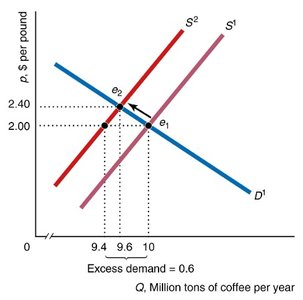
Shift in the Supply Curve
An increase in input prices shifts the supply curve left, causing excess demand at the original price and a new, higher equilibrium price.
Government Intervention
Governments can affect market outcomes through policies that shift supply or demand, or by imposing price controls.
Price Controls: Price ceilings (maximum price) and price floors (minimum price) can create persistent excess demand or supply.
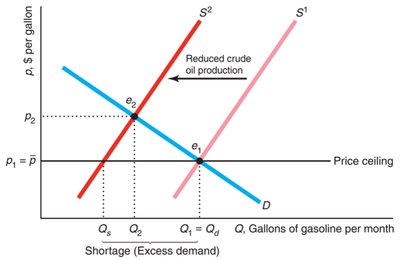
Price Ceilings
A price ceiling set below equilibrium creates a shortage (excess demand).
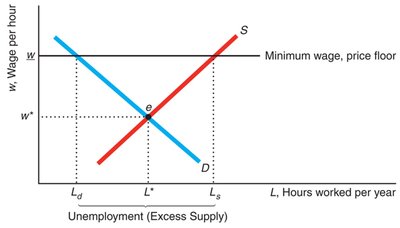
Price Floors
A price floor set above equilibrium creates a surplus (excess supply), such as unemployment in labor markets.
Sales Taxes and Tax Incidence
Sales taxes can be imposed on either producers or consumers, shifting the supply or demand curve. The equilibrium outcome is the same regardless of which side is taxed, but the burden is shared depending on the relative elasticities of supply and demand.
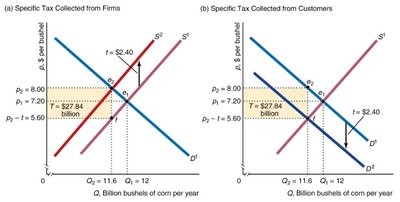
Tax Pass-Through: Firms may not pass the entire tax to consumers; the division depends on the shapes of the supply and demand curves.
Perfect Competition and the S-D Model
The supply-and-demand model is most accurate in perfectly competitive markets, characterized by many buyers and sellers, identical products, full information, negligible transaction costs, and easy entry/exit.
Price Takers: All firms and consumers accept the market price.
Market Power: In noncompetitive markets, firms may set prices above those predicted by the S-D model.
