 Back
BackSupply in Competitive Markets: Individual and Market Supply, Marginal Costs, and Supply Shifts
Study Guide - Smart Notes
 Tailored notes based on your materials, expanded with key definitions, examples, and context.
Supply in Competitive Markets
Introduction to Supply
Supply in microeconomics refers to the relationship between the price of a good and the quantity that producers are willing and able to sell. This section explores individual and market supply, the role of marginal costs, and the factors that shift supply curves.
Individual Supply
Definition and Example
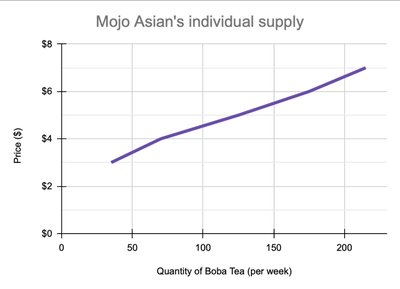
Individual supply is the quantity of a good that a single producer is willing to sell at various prices, holding all other factors constant. For example, Mojo Asian, a Boba Tea shop, decides how much Boba Tea to produce at different prices.
Supply Schedule: A table showing the quantity supplied at each price.
Supply Curve: A graphical representation with price on the vertical axis and quantity on the horizontal axis.
Law of Supply: The quantity supplied increases as the price increases, ceteris paribus.
Analyzing the Individual Supply Curve
The individual supply curve is typically upward-sloping, reflecting that higher prices incentivize greater production. The curve represents a set of plans, which remain valid as long as other factors (like input costs) do not change.
Marginal Cost and the Supply Curve
Marginal Cost and Rational Rule for Sellers
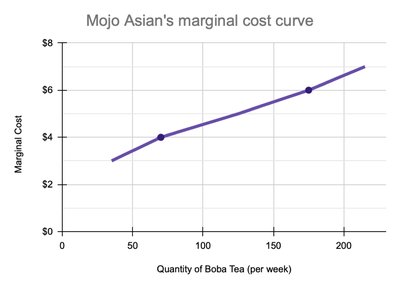
Marginal cost (MC) is the additional cost of producing one more unit of output. In perfectly competitive markets, firms are price-takers and maximize profit by producing up to the point where price equals marginal cost:
Rational Rule for Sellers: Sell one more unit if .
Marginal Principle: Convert “how many” to “one more?”
Cost-Benefit Principle: Sell if marginal benefit (price) is at least as large as marginal cost.
Opportunity Cost Principle: Consider alternative uses of resources.
The individual supply curve is the same as the marginal cost curve above the shutdown point.
Types of Costs
Variable Costs: Costs that change with output (e.g., ingredients, labor).
Fixed Costs: Costs that do not change with output (e.g., rent, equipment).
Marginal cost depends only on variable costs in the short run.
In the short run, some inputs are fixed; in the long run, all inputs are variable.
Short Run vs. Long Run Supply
Short Run: Some inputs are fixed; supply curve is steeper due to limited flexibility.
Long Run: All inputs are variable; firms can adjust capacity, making the supply curve flatter.
Why the Supply Curve Slopes Upward
Increasing Marginal Costs: At some point, producing additional units becomes more expensive due to:
Diminishing Marginal Product: Adding more of a variable input yields smaller increases in output.
Rising Input Costs: As production expands, input prices may rise due to scarcity or higher opportunity costs.
Market Supply
From Individual to Market Supply
Market supply is the total quantity supplied by all producers at each price. It is found by horizontally summing individual supply curves (adding quantities at each price).
Market supply increases with price due to both intensive (existing firms produce more) and extensive (new firms enter) margins.
Estimating Market Supply
Survey potential suppliers (including potential entrants).
Add up total quantity supplied at each price.
Scale up survey results to represent the whole market.
Plot the market supply curve.
Intensive vs. Extensive Margin
Intensive Margin: Existing suppliers adjust their output as price changes.
Extensive Margin: Entry or exit of firms in response to price changes.
Movements Along vs. Shifts of the Supply Curve
Movement Along the Curve
A change in price causes a movement along the supply curve (change in quantity supplied).
Shifts of the Supply Curve
Changes in factors other than price shift the entire supply curve (change in supply). These factors include:
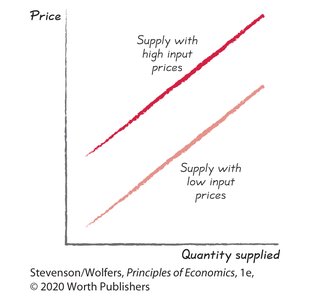
Input Costs: Higher input costs decrease supply (shift left/up); lower input costs increase supply (shift right/down).
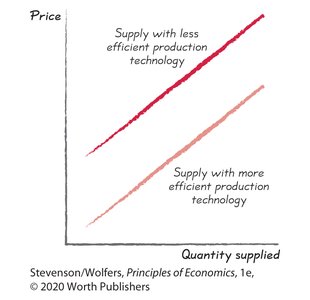
Productivity and Technology: Improved technology increases supply by lowering marginal costs.
Prices of Other Outputs: If the price of a substitute in production rises, supply of the original good decreases; if the price of a complement in production rises, supply increases.
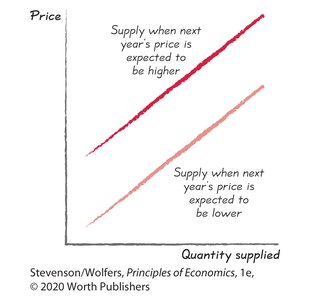
Expectations: If future prices are expected to rise, current supply may decrease (for storable goods); long-run expectations can increase investment and future supply.
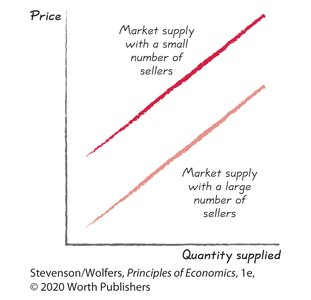
Number and Type of Sellers: More sellers increase market supply; fewer sellers decrease it.
Summary Table: Factors Shifting Supply
Factor | Effect on Supply |
|---|---|
Input Costs | Higher costs decrease supply; lower costs increase supply |
Productivity/Technology | Higher productivity increases supply |
Prices of Other Outputs | Higher price of substitutes decreases supply; higher price of complements increases supply |
Expectations | Expecting higher future prices can decrease current supply (for storable goods) |
Number of Sellers | More sellers increase supply; fewer sellers decrease supply |
Key Equations
Rational Rule for Sellers:
Market Supply (horizontal sum):
Key Takeaways
The supply curve shows the relationship between price and quantity supplied, holding other factors constant.
Marginal cost determines the shape of the supply curve; supply increases with price due to increasing marginal costs.
Market supply is the sum of individual supplies.
Five main factors shift the supply curve: input costs, productivity/technology, prices of other outputs, expectations, and the number/type of sellers.
Price changes cause movements along the supply curve, not shifts.
