 Back
BackThe U.S. and Global Economies: What, How, and For Whom Goods and Services Are Produced
Study Guide - Smart Notes
 Tailored notes based on your materials, expanded with key definitions, examples, and context.
The U.S. and Global Economies
What, How, and For Whom?
This section introduces the foundational questions of economics: what goods and services are produced, how they are produced, and for whom they are produced. These questions are central to understanding both the U.S. and global economies.
What Do We Produce?
Consumption goods and services: Goods and services bought by individuals for personal enjoyment and to improve their standard of living. Example: Movies, laundromat services.
Capital goods: Goods bought by businesses to increase productive resources. Example: Cranes, trucks.
How Do We Produce?
Goods and services are produced using factors of production, which are grouped into four categories:
Land: All natural resources used in production, including minerals, water, air, plants, animals, farmland, and forests. Some resources are renewable, others are not.
Labor: The work time and effort people devote to production. The quality of labor depends on human capital—knowledge and skills from education, training, and experience.
Capital: Tools, machines, buildings, and other items produced in the past and used to produce goods and services. Note: Money, stocks, and bonds are financial resources, not capital.
Entrepreneurship: The human resource that organizes land, labor, and capital, makes business decisions, and bears risks.
For Whom Do We Produce?
The distribution of goods and services depends on income, which is earned by selling the services of factors of production:
Rent: Income for the use of land.
Wages: Income for labor.
Interest: Income for capital.
Profit (or loss): Income for entrepreneurship.
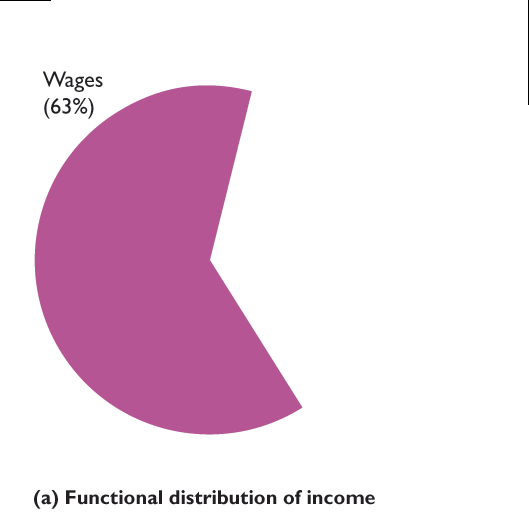
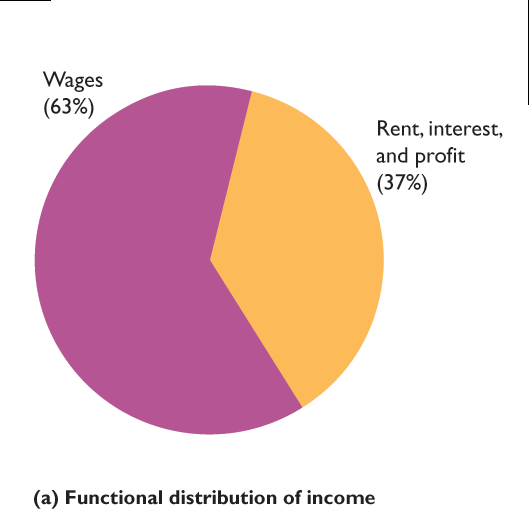
There are two main types of income distribution:
Functional distribution of income: Distribution among factors of production (rent, wages, interest, profit).
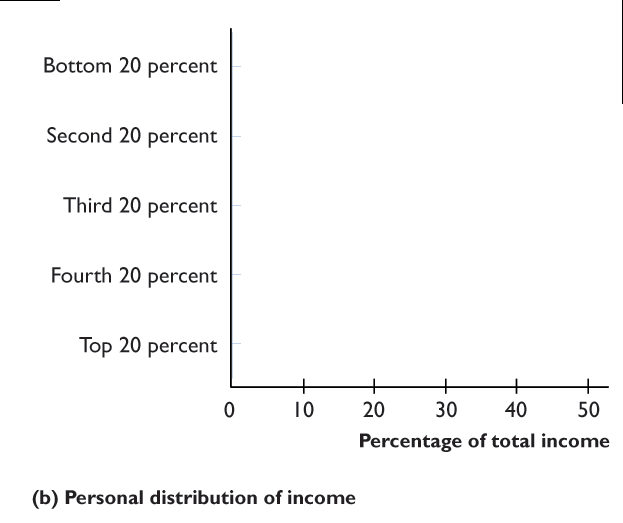
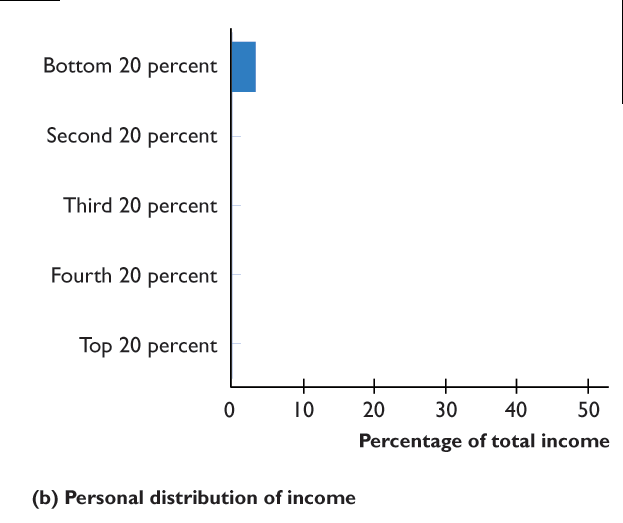
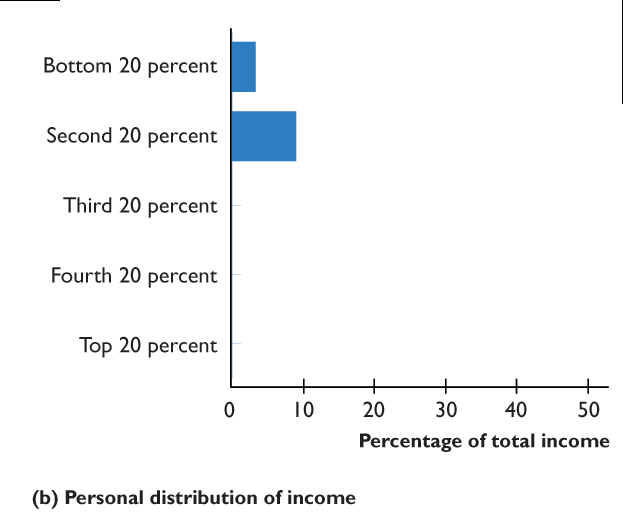
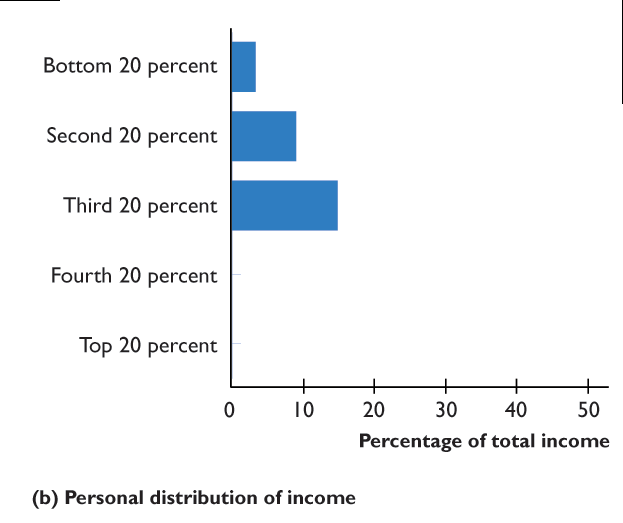
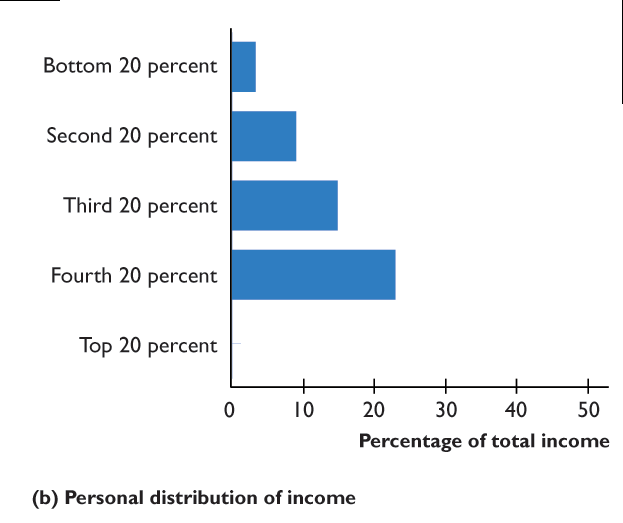
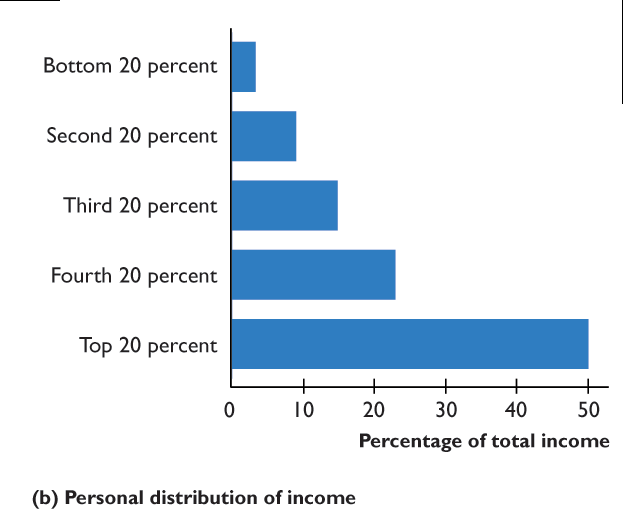
Personal distribution of income: Distribution among households (from richest to poorest).
The Global Economy
Advanced Economies vs. Emerging Markets
Advanced economies: The richest 29 countries, home to about 1 billion people (15% of world population).
Emerging market economies: 28 countries in Central and Eastern Europe and Asia, with about 500 million people.
Developing economies: 119 countries in Africa, Asia, the Middle East, Europe, and the Americas, with more than 5.5 billion people.
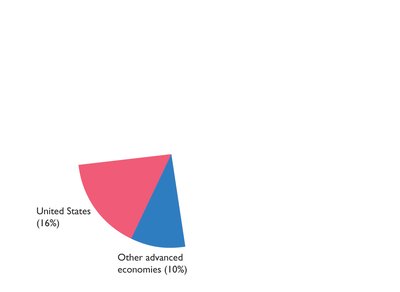
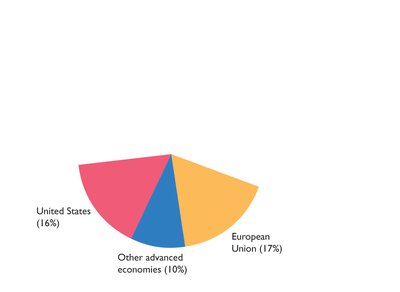
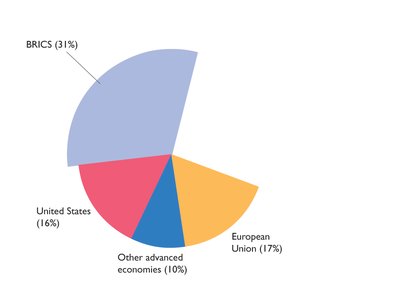
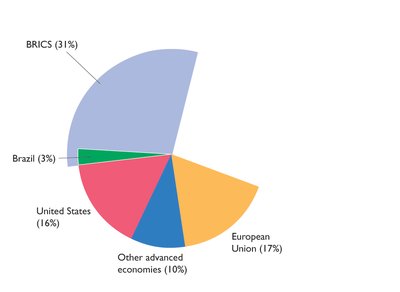
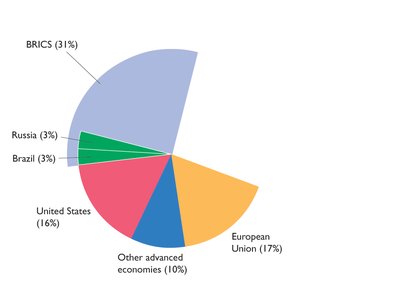
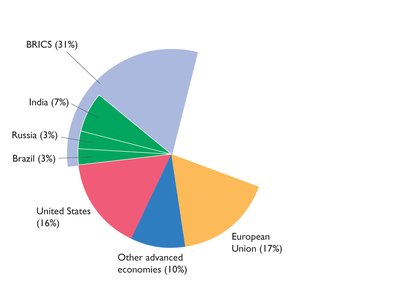
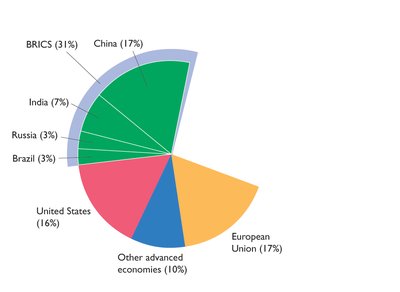
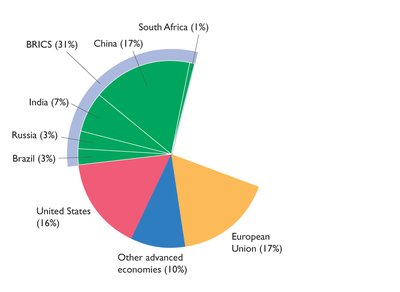
Global Production and Distribution
In 2025, global production was worth about $113 trillion. The distribution of production among regions is shown in the following pie charts:
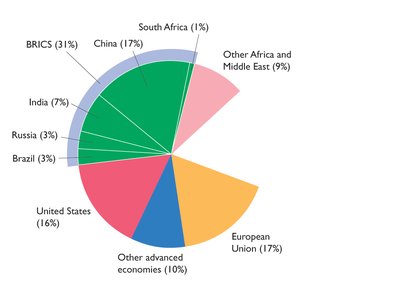
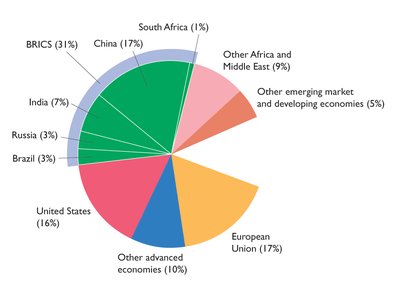
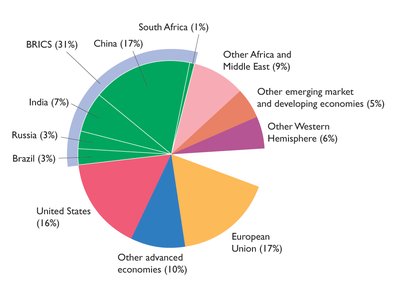
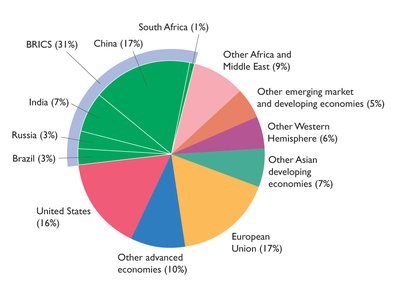
Differences and Similarities in Production
Developing economies: Large manufacturing industries (textiles, footwear, electronics, etc.), and significant food production.
Advanced economies: Smaller share of agriculture and manufacturing; larger and growing share of services.
Human Capital and Physical Capital Differences
Human capital: Quality of labor varies greatly between advanced and developing economies due to differences in education, training, experience, physical ability, and health.
Physical capital (infrastructure): Advanced economies have more developed transportation systems and use more capital-intensive technologies.
Income Distribution in the Global Economy
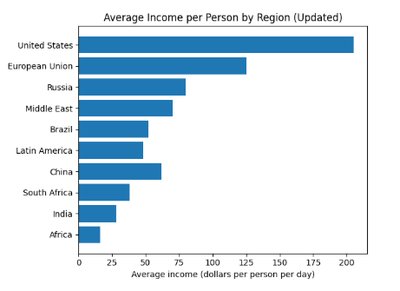
Who gets the world’s goods and services depends on the incomes people earn. Average income per person by region is shown below:
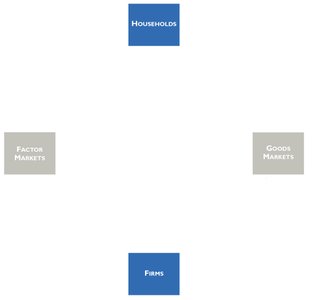
The Circular Flow Model
Overview
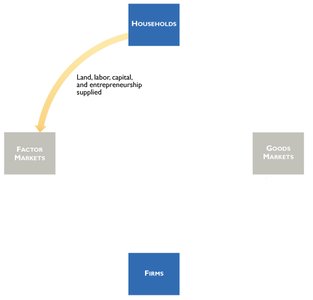
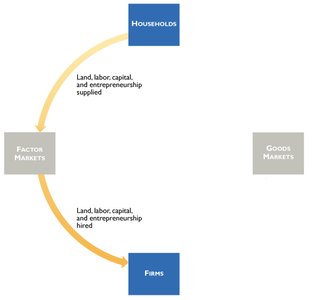
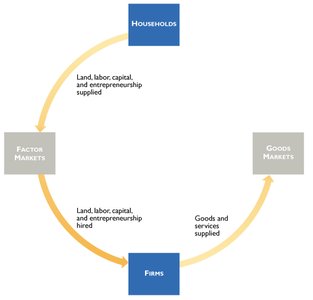
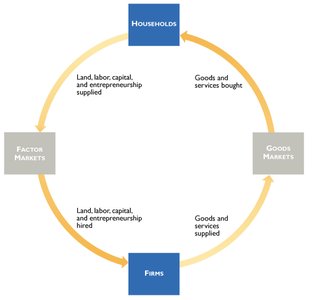
The circular flow model illustrates the flow of expenditures and incomes resulting from choices made by households and firms, and how these interact in markets to determine what, how, and for whom goods and services are produced.
Households and Firms
Households: Individuals or groups living together as decision-making units.
Firms: Institutions that organize production of goods and services.
Markets
Goods markets: Where goods and services are bought and sold.
Factor markets: Where factors of production are bought and sold.
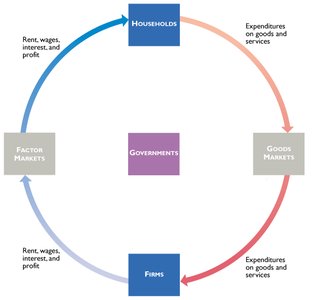
Real Flows and Money Flows
Real flows: Movement of actual goods, services, and factors of production.
Money flows: Movement of payments for goods, services, and factors of production.


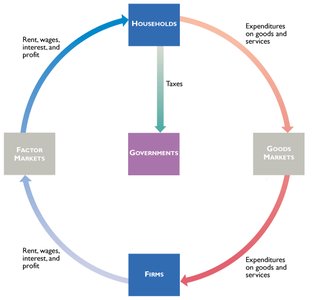
Government in the Circular Flow
Federal government: Provides goods and services, social security, welfare benefits, and transfers to state/local governments. Financed by personal income, corporate, and social security taxes.
State and local governments: Provide goods, services, and welfare benefits. Financed by sales, property, and state income taxes.

Circular Flows in the Global Economy
International trade: Buying and selling goods and services across borders (imports and exports).
International finance: Borrowing and lending across countries, often influenced by interest rates and trade balances.
These flows tie nations together and transmit global booms and slumps.
Key Terms and Concepts
Factors of production: Land, labor, capital, entrepreneurship.
Human capital: Skills and knowledge acquired through education and experience.
Functional distribution of income: Distribution among factors of production.
Personal distribution of income: Distribution among households.
Circular flow model: Shows the interaction between households, firms, markets, and government.
Advanced economies: High-income, developed countries.
Emerging market economies: Countries with rapidly growing economies.
Developing economies: Countries with lower average incomes.
Formulas and Equations
Income from factors of production:
Personal distribution of income:
Example: Boeing Dreamliner Production
Boeing manufactures the Dreamliner at the lowest possible cost by coordinating over 400 firms across four continents. Each firm makes decisions and pays workers, investors, and suppliers, illustrating the global nature of production and the interaction of factors of production.
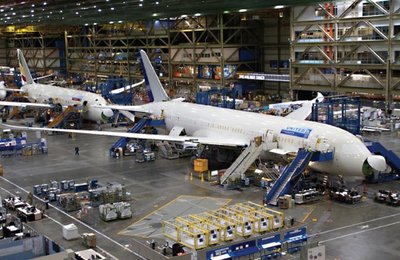
Additional info: The Dreamliner example demonstrates how global supply chains and factor markets operate in practice, reinforcing the concepts of what, how, and for whom goods are produced.
