 Back
BackLab Exam 2 Review – Cell Biology & Enzyme Function Guidance
Study Guide - Smart Notes
 Tailored notes based on your materials, expanded with key definitions, examples, and context.
Q5. What do prokaryotic cells look like under the microscope as well as plant cells such as Elodea, and onion?
Background
Topic: Cell Structure and Microscopy
This question tests your ability to recognize and distinguish between prokaryotic cells and plant cells (Elodea, onion) based on their microscopic appearance.
Key Terms:
Prokaryotic cells: Cells without a nucleus or membrane-bound organelles (e.g., bacteria).
Plant cells: Eukaryotic cells with a nucleus, chloroplasts, and a cell wall (e.g., Elodea, onion).
Microscope: Instrument used to view cells at high magnification.
Step-by-Step Guidance
Recall the main differences between prokaryotic and plant cells. Prokaryotic cells are generally smaller, lack a nucleus, and have a simpler structure. Plant cells are larger, have a nucleus, chloroplasts, and a rigid cell wall.
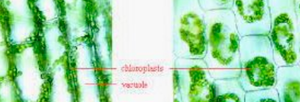
Think about the typical microscopic features of Elodea and onion cells. Elodea cells often show green chloroplasts, while onion cells do not have chloroplasts but have a clear cell wall and nucleus.
Review images or slides from lab to identify distinguishing features. For example, look for chloroplasts in Elodea and the rectangular shape of onion cells.
Compare these features to prokaryotic cells, which usually appear as small, round or rod-shaped cells without internal organelles.
Try solving on your own before revealing the answer!
Final Answer:
Prokaryotic cells appear as small, simple shapes (rods, spheres) without visible internal structures. Elodea cells show green chloroplasts and a cell wall, while onion cells have a cell wall and nucleus but lack chloroplasts.
The image above highlights chloroplasts and vacuoles in Elodea cells, which are key features distinguishing plant cells from prokaryotes.
Q14. What does this graph illustrate about enzyme function?
Background
Topic: Enzyme Catalysis and Activation Energy
This question tests your understanding of how enzymes affect the activation energy and the overall energy change in a chemical reaction.
Key Terms and Formulas:
Activation energy (): The minimum energy required for a reaction to occur.
Enzyme: A protein that speeds up chemical reactions by lowering activation energy.
Free energy change (): The difference in energy between reactants and products.
Step-by-Step Guidance
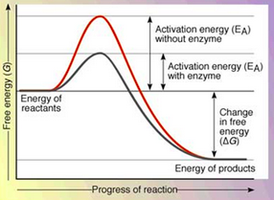
Examine the graph and identify the two curves: one for the reaction with an enzyme and one without.
Notice the difference in the height of the activation energy barrier () for each curve.
Understand that enzymes lower the activation energy, making the reaction proceed faster.
Observe that the overall change in free energy () remains the same, regardless of the presence of an enzyme.
Try solving on your own before revealing the answer!
Final Answer:
The graph illustrates that enzymes lower the activation energy required for a reaction, but do not change the overall free energy change () of the reaction.
This allows reactions to occur more quickly and efficiently in biological systems.
Q17. Which of the following tubes was the control in the Enzyme Specificity lab exercise?
Background
Topic: Experimental Controls in Enzyme Labs
This question tests your ability to identify the control group in an experiment, which is essential for interpreting results.
Key Terms:
Control: A sample that does not receive the experimental treatment, used for comparison.
Enzyme specificity: The ability of an enzyme to select its substrate.
Step-by-Step Guidance
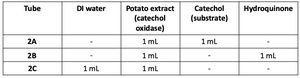
Review the table showing the contents of each tube: DI water, potato extract (catechol oxidase), catechol (substrate), and hydroquinone.
Identify which tube lacks the enzyme or substrate, as this is typically the control.
Consider the purpose of each tube: the control should show no reaction, serving as a baseline.
Compare the contents of each tube to determine which one fits the definition of a control.
Try solving on your own before revealing the answer!
Final Answer:
Tube 2C is the control because it contains only DI water and lacks both the enzyme and substrate, providing a baseline for comparison.
This allows you to see if any color change occurs without the enzyme or substrate present.
Q20. Which of the following tubes has the highest benzoquinone formation? Lowest?
Background
Topic: Enzyme Activity and Product Formation
This question tests your ability to interpret experimental results based on color intensity, which correlates with product formation.
Key Terms:
Benzoquinone: Product formed by catechol oxidase activity.
Color intensity: Indicates the amount of product formed.
Step-by-Step Guidance
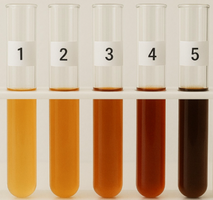
Observe the color of each tube. The darkest color indicates the highest benzoquinone formation, while the lightest color indicates the lowest.
Rank the tubes from lightest to darkest to determine which has the most and least product.
Consider the experimental setup and which tubes received the enzyme and substrate.
Use your observations to match the tube numbers to the highest and lowest benzoquinone formation.
Try solving on your own before revealing the answer!
Final Answer:
Tube 5 has the highest benzoquinone formation (darkest color), and tube 1 has the lowest (lightest color).
The color intensity directly reflects the amount of product formed in each reaction.
Q22. Circle the statements that are true for the image below.
Background
Topic: Enzyme Specificity and Reaction Mechanism
This question tests your understanding of enzyme-substrate interactions and the fate of enzymes during reactions.
Key Terms:
Enzyme specificity: Enzymes bind only to specific substrates.
Enzyme-substrate complex: Temporary association between enzyme and substrate.
Enzyme consumption: Whether enzymes are used up in reactions.
Step-by-Step Guidance
Examine the diagram showing the enzyme binding to the substrate, forming an enzyme-substrate complex, and releasing products.
Review the statements: substrate specificity, enzyme consumption, and whether enzymes are used up in reactions.
Recall that enzymes are not consumed in reactions and are substrate specific.
Identify which statements match the diagram and your knowledge of enzyme function.
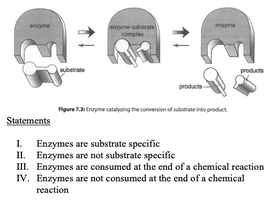
Try solving on your own before revealing the answer!
Final Answer:
Statements I and IV are true: Enzymes are substrate specific and are not consumed at the end of a chemical reaction.
The diagram shows the enzyme remaining unchanged after the reaction, supporting these statements.
