 Back
BackNutrition Labels and Healthy Eating: Study Guide for Nutrition Students
Study Guide - Smart Notes
 Tailored notes based on your materials, expanded with key definitions, examples, and context.
Nutrition Labels and Healthy Eating
Nutrition Labeling and Education Act
The Nutrition Labeling and Education Act (NLEA) was enacted in the United States in 1990 and came into effect in 1994, mandating nutrition labeling for packaged foods. In Canada, mandatory labeling began in 2005. Nutrition labels provide essential information to help consumers make informed food choices and compare products.
Nutrition Facts Panel: Required on all packaged foods, detailing serving size, calories, and nutrient content per serving.
Purpose: Helps consumers understand what is in their food and how it fits into a recommended diet.
Recent Updates: Since May 2016, new label formats have been phased in to reflect updated scientific information and improve clarity.
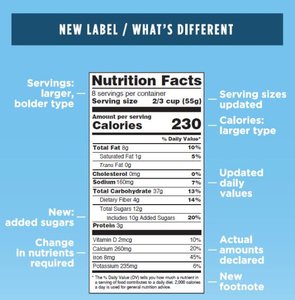
Key Changes in Nutrition Facts Labels
Recent changes to the Nutrition Facts label were made to improve consumer understanding and address common dietary deficiencies.
Calories from fat removed; focus is now on total calories.
Serving sizes updated to reflect actual consumption patterns.
Added sugars now listed as a subcategory of total sugars.
Vitamin D and potassium added to micronutrient list; vitamins A and C removed.
Micronutrient amounts shown in mg or mcg for easier planning.
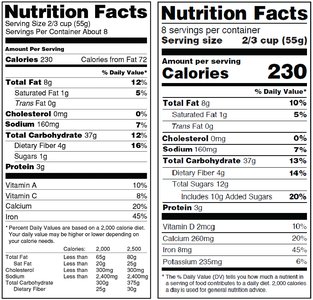
Reading the Nutrition Facts Panel
The Nutrition Facts panel provides information about serving size, calories, and selected nutrients. Understanding this panel is crucial for making healthy food choices.
Serving Size: Defines the amount considered one serving and the number of servings per package.
Calories: Listed per serving; refers to kilocalories (kcals).
Percent Daily Value (% DV): Indicates the percentage of the recommended daily intake for each nutrient, based on a 2,000-kcal diet.
Low % DV: Under 5% (e.g., saturated fat, sodium).
High % DV: 20% or more (e.g., fiber, vitamins).
Sample Daily Values Table
The following table summarizes Daily Values for key nutrients based on a 2,000-kcal diet:
Food Component | Daily Value |
|---|---|
Total Fat | 65 g |
Saturated Fat | 20 g |
Cholesterol | 300 mg |
Sodium | 2,400 mg |
Potassium | 3,500 mg |
Total Carbohydrate | 300 g |
Dietary Fiber | 25 g |
Protein | 50 g |
Calcium | 1,000 mg |
Iron | 18 mg |
Vitamin D | 400 IU |
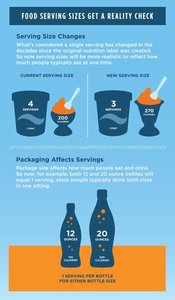
Serving Size Updates
Serving sizes have been updated to reflect how much people actually eat, and packaging affects the number of servings per container.
Serving Size Changes: Now based on typical consumption, not ideal portion sizes.
Packaging: Single-serving packages are clearly labeled.
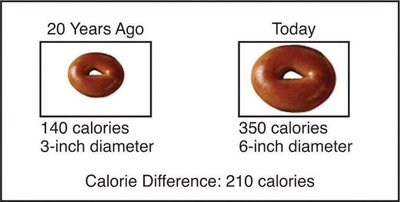
Portion Size and Caloric Intake
Portion sizes in restaurants and packaged foods have increased over time, leading to higher caloric intake. Estimating portion sizes is important for maintaining a healthy diet.
Portion Distortion: Larger plates and servings can lead to unintentional overeating.
Physical Activity: Sedentary lifestyles make it harder to balance increased caloric intake.
Label Claims and Regulations
The FDA regulates claims on food labels to ensure accuracy and prevent misleading information.
Nutrient Claims: Describe the amount of nutrients (e.g., low-fat, low-sodium).
Health Claims: Link foods to reduced risk of disease; must be substantiated by scientific evidence.
Qualified Health Claims: Supported by some evidence but not conclusive; must include specific wording.
Structure/Function Claims: Describe the role of a nutrient in normal body function; not regulated by FDA.
Allergy Warnings: Required for the eight most common allergens (milk, eggs, peanuts, tree nuts, fish, shellfish, soy, wheat).
Estimating Portion Size
Visual aids and common objects can help estimate portion sizes for different foods.
Food Product | Amount | Object Comparison | Hand Comparison |
|---|---|---|---|
Pasta, rice | ½ cup | Tennis ball | Cupped hand |
Fresh vegetables | 1 cup | Baseball | |
Cooked vegetables | ½ cup | Cupped hand | |
Meat, poultry, fish | 3 oz. | Deck of cards | Palm of your hand |
Milk or other beverages | 1 cup | Fist | |
Salad dressing | 1 Tbsp. | Thumb | |
Oil | 1 tsp. | Thumb tip |
Building Healthy Eating Patterns
Factors Influencing Food Choices
Food choices are influenced by a variety of factors, including sex, genetics, income, religion, culture, education, lifestyle, age, and environment. Health-promoting organizations use models to address these factors and promote healthy eating.
Socioeconomic Model: Used to guide interventions for healthy eating and physical activity.
Food Insecurity: Lower economic prosperity reduces food quality and access.

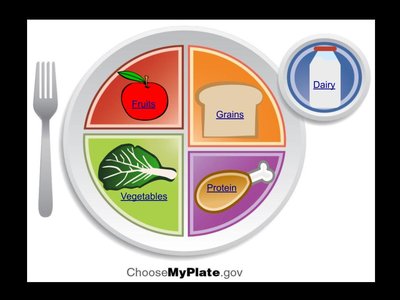
MyPlate Planner
MyPlate is a visual tool developed by the USDA to help Americans build healthy eating patterns. It divides the plate into food groups and provides guidelines for balanced meals.
Fill half your plate with vegetables and fruits, emphasizing vegetables.
Fill one-quarter with lean protein sources (meat, poultry, fish, legumes, tofu).
Fill one-quarter with whole grains (e.g., brown rice).
Choose one serving of dairy (preferably low-fat or non-fat).
Add plant-based oils in moderation.
Choosing Nutrient-Dense Foods
Nutrient-dense foods provide the most nutrients for the fewest calories. Variety in protein sources and choosing low-fat dairy products are recommended for optimal health.
Include nuts, seeds, beans, legumes, poultry, soy, and seafood.
Choose lean cuts of meat and prepare with minimal added saturated fat.
Low-fat and nonfat dairy products offer essential nutrients with fewer calories.
Plant-based oils are preferable to animal fats.
Discretionary Calories
Discretionary calories are those remaining after meeting nutrient needs within your daily caloric limit. They can be used for additional foods or beverages, but should be consumed judiciously.
Discretionary calorie allowance increases with physical activity and decreases with age.
For most active adults, discretionary calories are about 15% of total caloric intake.
Sample Menu Plan (2,000 Calories)
Meal | Calories |
|---|---|
Breakfast | 299 |
Snack | 132 |
Lunch | 467 |
Snack | 225 |
Dinner | 691 |
Total | 1,814 |
Discretionary Calories | 186 |
The Whole Nutrient Package and Disease Prevention
Health Benefits of Fruits and Vegetables
A diet rich in fruits and vegetables reduces the risk of cardiovascular disease, cancer, and other chronic diseases. Whole foods provide synergistic health benefits due to their complex mixtures of nutrients and phytochemicals.
Insufficient fruit and vegetable intake is linked to increased risk of gastrointestinal cancer, heart attack, and stroke.
WHO estimates 2.7 million deaths could be prevented annually by increasing fruit and vegetable intake.
Antioxidants and phytochemicals in plant foods promote health.
Dietary Patterns for Health
Mediterranean Diet: Emphasizes fruits, vegetables, olive oil, herbs, and low amounts of red meat. Associated with reduced risk of chronic diseases.
DASH Diet: Focuses on low saturated fat, cholesterol, and total fat; emphasizes fruits, vegetables, whole grains, and low-fat dairy.
Diets High in Fruits and Vegetables: Each additional serving per day lowers heart disease risk by 4%.
Improving Fruit and Vegetable Intake
The CDC recommends strategies to increase access and consumption of fruits and vegetables:
Support local and state governments in food policy development.
Increase availability and affordability in underserved populations.
Promote farm-to-community programs.
Encourage institutions to serve more fruits and vegetables.
Support schools in healthy food messaging and gardening activities.
Develop and support community and home gardens.
Increase supply in emergency food programs.
Additional info:
Eating more fruits and vegetables improves cognitive function at all ages.
Less than 10% of Americans meet recommended fruit and vegetable intake.
