 Back
BackChapter 12: Infrared (IR) and Mass Spectroscopy – Study Notes
Study Guide - Smart Notes
 Tailored notes based on your materials, expanded with key definitions, examples, and context.
Infrared (IR) and Mass Spectroscopy
Introduction to Spectroscopy
Spectroscopy is the study of the interaction between electromagnetic radiation and matter. It is a fundamental analytical technique in organic chemistry for determining the structure, composition, and properties of molecules. The main types of spectroscopy used in organic chemistry include Nuclear Magnetic Resonance (NMR), Infrared (IR), and Ultraviolet-Visible (UV-Vis) spectroscopy. Mass spectrometry (MS), while not a true spectroscopic technique, is also essential for molecular analysis.
Spectroscopy involves the absorption, emission, or scattering of light by matter.
Mass spectrometry measures the mass-to-charge ratio of ions and does not involve light absorption or emission.
Principles of Molecular Spectroscopy
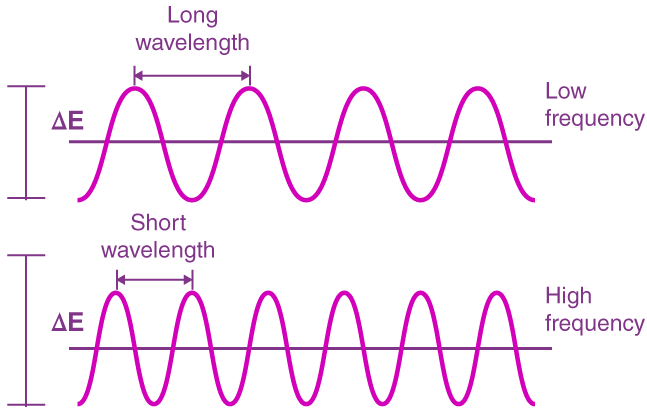
Light exhibits both wave-like and particle-like properties (wave-particle duality). In spectroscopy, the wave properties—specifically wavelength (λ) and frequency (ν)—are used to study molecular interactions with light.
Frequency (ν): Number of wave cycles per second (Hz).
Wavelength (λ): Distance between two consecutive peaks or troughs.
Frequency and wavelength are inversely proportional: $c = \lambda \nu$
Photon energy: $E = h\nu$
Molecular Energy Quantization
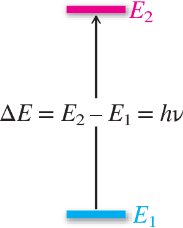
Molecular energies are quantized, meaning molecules can only occupy discrete energy levels. When a molecule absorbs a photon of the correct energy, it transitions from a lower energy state (E1) to a higher energy state (E2):
Energy difference: $\Delta E = E_2 - E_1 = h\nu$
Absorption occurs only if the photon's energy matches the energy gap between quantized states.
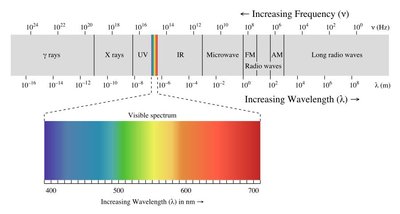
Types of Molecular Transitions
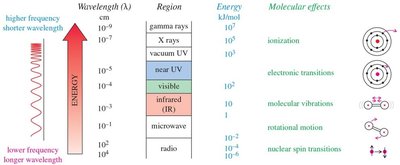
The type of molecular transition depends on the energy of the absorbed light:
Ionization (high energy, UV/X-ray)
Electronic transitions (UV-Vis)
Molecular vibrations (IR)
Rotational motion (microwave)
Nuclear spin transitions (radiofrequency, NMR)
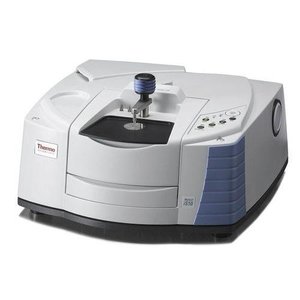
Infrared (IR) Spectroscopy
Principles of IR Spectroscopy
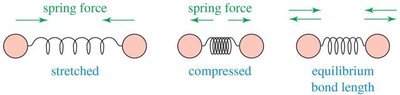
IR spectroscopy is based on the absorption of infrared light, which causes molecular vibrations. The frequency of vibration depends on the bond strength and the masses of the atoms involved. Only vibrations that result in a change in dipole moment are IR-active.
Vibrational Modes: Stretching (symmetric, asymmetric) and bending (scissoring, rocking, wagging, twisting).
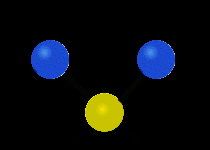
Nonlinear molecule with n atoms: 3n – 6 vibrational modes.
Linear molecule with n atoms: 3n – 5 vibrational modes.


IR-Active and IR-Inactive Vibrations
For a vibration to be IR-active, it must change the dipole moment of the molecule. Symmetrical molecules often have IR-inactive vibrations. The intensity of an IR absorption depends on the magnitude of the dipole moment change during vibration.
Stronger dipole moment change → more intense IR peak
Bond strength and atomic masses affect vibrational frequency:
Stronger bonds (higher force constant, k) → higher frequency
Heavier atoms (higher reduced mass, μ) → lower frequency
Vibrational frequency formula: $\nu = \frac{1}{2\pi} \sqrt{\frac{k}{\mu}}$
Wavenumbers and IR Spectra Regions
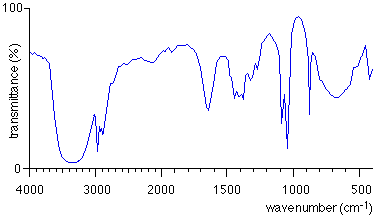
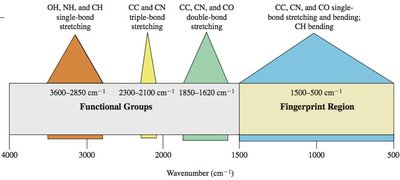
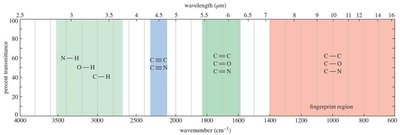
IR spectra are typically plotted as percent transmittance versus wavenumber (cm−1), which is the reciprocal of wavelength. The IR spectrum is divided into regions:
Functional group region: 4000–1500 cm−1
Fingerprint region: 1500–500 cm−1 (unique to each molecule)
Interpretation of IR Spectra
Key absorption bands in IR spectra correspond to specific bond vibrations and functional groups:
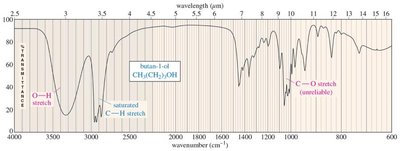
C–H stretching: sp3 (2800–3000 cm−1), sp2 (3000–3100 cm−1), sp (~3300 cm−1, sharp)
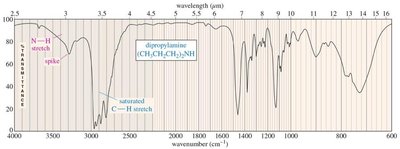
O–H and N–H stretching: ~3300 cm−1 (O–H broad, N–H broad with spikes)
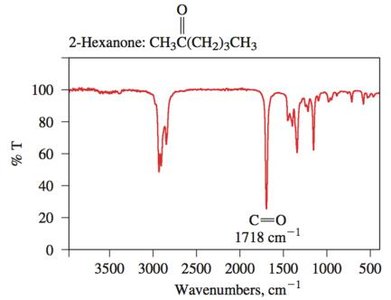
Carbonyl (C=O) stretching: ~1700 cm−1 (strong, sharp)
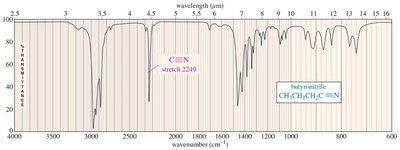
C≡N stretching: >2200 cm−1 (stronger than C≡C)
Summary Table: IR Stretching Frequencies
Frequency (cm−1) | Functional Group | Comments |
|---|---|---|
3300 | alcohol O–H, amine N–H, alkyne ≡C–H | O–H always broad; N–H may be broad, sharp, or with spikes; ≡C–H always sharp, usually strong |
3000 | alkane C–H | just below 3000 cm−1 |
2200 | alkyne C≡C, nitrile C≡N | just below 2200 cm−1 (alkyne); just above 2200 cm−1 (nitrile) |
1710 | carbonyl C=O | ketones, acids about 1710 cm−1; aldehydes about 1725 cm−1; esters higher, about 1735 cm−1; conjugation lowers frequency |
1660 | alkene C=C, imine C=N | alkene about 1660 cm−1; imine stronger than C=C |
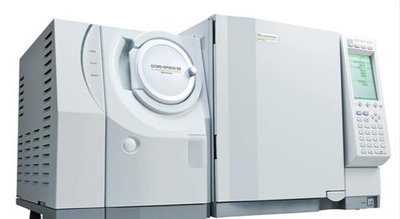
Mass Spectrometry (MS)
Principles of Mass Spectrometry
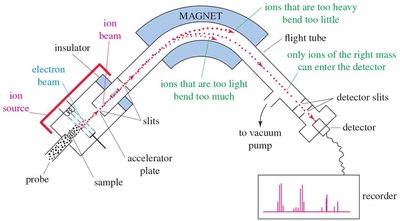
Mass spectrometry is an analytical technique used to determine the mass-to-charge ratio (m/z) of ions. It is a destructive technique and does not involve light absorption or emission. The main components of a mass spectrometer are:
Ion Source: Ionizes the sample (e.g., Electron Impact, Electrospray Ionization, MALDI).
Mass Analyzer: Separates ions based on m/z.
Detector: Measures and records the abundance of ions.
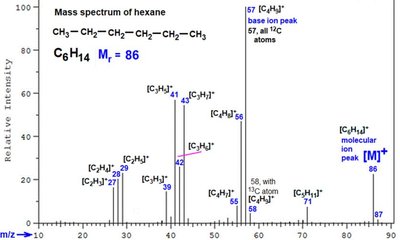
Mass Spectrum Interpretation
Molecular ion (M+): The highest-mass ion, usually the unfragmented molecule.
Base peak: The most intense peak, assigned 100% abundance.
Fragmentation patterns provide structural information.
Fragmentation Patterns
Homolytic cleavage: Produces a cation (detected) and a radical (not detected).
α-Cleavage: Cleavage next to a carbonyl group, forming resonance-stabilized acylium ions.
McLafferty rearrangement: β-cleavage involving transfer of a hydrogen atom, common in carbonyl compounds with long chains.
Isotopes in Mass Spectra
Isotopic variants of elements produce characteristic patterns in mass spectra:
Carbon: 12C (98.9%), 13C (1.1%) – M+1 peak
Chlorine: 35Cl (75%), 37Cl (25%) – M and M+2 peaks in 3:1 ratio
Bromine: 79Br (50%), 81Br (50%) – M and M+2 peaks of equal intensity
Practice Problems and Applications
Interpret IR and mass spectra to identify functional groups and molecular structure.
Use fragmentation patterns and isotopic peaks to deduce molecular formulas and structures.
Summary
Infrared (IR) and Mass Spectroscopy are essential tools in organic chemistry for identifying functional groups, determining molecular structure, and analyzing molecular composition. Mastery of these techniques is crucial for interpreting experimental data and solving structural problems in organic chemistry.
