 Back
BackOrganic Chemistry Mass Spectrometry & IR Spectroscopy Study Guide
Study Guide - Smart Notes
 Tailored notes based on your materials, expanded with key definitions, examples, and context.
Q1. Describe the fate of a molecule from introduction to detection in a mass spectrometer.
Background
Topic: Mass Spectrometry Principles
This question tests your understanding of the steps a molecule undergoes in a mass spectrometer, from sample introduction to detection.
Key Terms:
Ionization: The process of converting molecules into ions.
Acceleration: Ions are accelerated by an electric field.
Deflection: Ions are separated based on their mass-to-charge ratio (m/z).
Detection: Ions are detected and their abundance is measured.
Step-by-Step Guidance
Consider how the sample is introduced into the mass spectrometer (usually vaporized).
Think about the ionization process—how the molecule is converted into ions (e.g., electron impact).
Reflect on how ions are accelerated and separated based on their m/z values.
Consider how the detector records the ions and generates a mass spectrum.
Try solving on your own before revealing the answer!
Q2. 2-Methylhexane shows an intense peak in the mass spectrum at m/z = 43. Propose a likely structure for this fragment by generating its molecular ion peak first.
Background
Topic: Mass Spectrometry Fragmentation
This question tests your ability to interpret mass spectra and propose fragment structures based on observed peaks.
Key Terms:
Molecular ion (M+): The ion formed by removal of an electron from the molecule.
Fragment ion: An ion formed by the breakdown of the molecular ion.
m/z: Mass-to-charge ratio.
Step-by-Step Guidance
Write the molecular formula for 2-methylhexane and calculate its molecular ion peak (M+).
Consider common fragmentation patterns for alkanes, especially those leading to m/z = 43.
Identify which fragment (e.g., propyl, butyl, isopropyl) could correspond to m/z = 43.
Draw the structure of the fragment and relate it to the parent molecule.
Try solving on your own before revealing the answer!
Q3. The mass spectrum of an unknown compound has a molecular ion peak with a relative abundance of 43.27% and an M + 1 peak with a relative abundance of 3.81%. How many carbon atoms are in the compound?
Background
Topic: Isotopic Abundance in Mass Spectrometry
This question tests your ability to use isotopic ratios (especially ) to estimate the number of carbon atoms in a compound.
Key Terms and Formula:
Molecular ion peak (M): The main peak for the compound.
M+1 peak: Peak due to isotope.
Natural abundance of : About 1.1% per carbon atom.
Step-by-Step Guidance
Identify the relative abundances of the M and M+1 peaks from the question.
Recall that each carbon atom contributes about 1.1% to the M+1 peak.
Set up the ratio:
Plug in the values and prepare to solve for the number of carbon atoms.
Try solving on your own before revealing the answer!
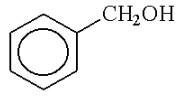
Q4. Which of the following m/z values is the base peak for benzyl alcohol, and why?
Background
Topic: Mass Spectrometry of Aromatic Alcohols
This question tests your knowledge of fragmentation patterns and base peaks in mass spectra, specifically for benzyl alcohol.
Key Terms:
Base peak: The most intense peak in a mass spectrum.
Fragmentation: Breakdown of the molecular ion into smaller ions.
Benzyl alcohol:
Step-by-Step Guidance
Recall the structure of benzyl alcohol and common fragmentation patterns.
Consider which fragment ions are most stable and likely to be the base peak.
Analyze the given m/z values and relate them to possible fragments (e.g., tropylium ion at m/z = 91).
Think about why a particular fragment would dominate the spectrum.
Try solving on your own before revealing the answer!
Q5. Show the formations of fragments at m/z values 102, 45, 87, and 84 from the molecular ion peak of 2-hexanol.
Background
Topic: Mass Spectrometry Fragmentation of Alcohols
This question tests your ability to predict and explain fragment ions from the mass spectrum of 2-hexanol.
Key Terms:
2-hexanol: An alcohol with the formula
Fragmentation: Loss of groups such as water, alkyl chains, or hydrogen.
m/z: Mass-to-charge ratio.
Step-by-Step Guidance
Write the molecular formula and calculate the molecular ion peak for 2-hexanol.
Consider possible fragmentations: loss of water, alkyl groups, or hydrogen.
Relate each m/z value to a specific fragmentation pathway.
Draw or describe the structure of each fragment.
Try solving on your own before revealing the answer!
Q6. Which compound would be expected to show intense IR absorption at 1746 cm-1? Justify your answer.
Background
Topic: Infrared Spectroscopy (IR)
This question tests your ability to identify functional groups based on their characteristic IR absorption frequencies.
Key Terms:
IR absorption: The frequency at which a bond absorbs infrared light.
Carbonyl group (C=O): Typically absorbs strongly near 1740–1750 cm-1.
Esters, aldehydes, ketones: Functional groups with characteristic IR absorptions.
Step-by-Step Guidance
Review the structures of the given compounds.
Identify which compound contains a carbonyl group (C=O).
Recall that esters typically absorb near 1746 cm-1.
Justify your answer based on the functional group present.
Try solving on your own before revealing the answer!
Q7. Propose the expected IR absorbance of phenylacetylaldehyde.
Background
Topic: IR Spectroscopy of Aromatic Aldehydes
This question tests your ability to predict IR absorption frequencies for specific functional groups in aromatic aldehydes.
Key Terms:
Phenylacetylaldehyde: Contains both aromatic and aldehyde functional groups.
Aldehyde C=O stretch: Typically around 1720–1740 cm-1.
Aromatic ring: Characteristic absorptions in the 1500–1600 cm-1 region.
Step-by-Step Guidance
Identify the functional groups present in phenylacetylaldehyde.
Recall the typical IR absorption frequencies for aldehyde and aromatic groups.
Predict the main IR peaks based on these functional groups.
Consider any additional peaks due to C-H stretches or overtones.
Try solving on your own before revealing the answer!
