 Back
BackPhase Diagrams and Microstructure in Solid Materials: Study Notes for Organic Chemistry Context
Study Guide - Smart Notes
 Tailored notes based on your materials, expanded with key definitions, examples, and context.
Solid Materials and Microstructure
Phases and Microstructure
Solid materials are composed of one or more phases, each with a distinct composition and atomic structure. These phases often fuse to form a coherent material, typically polycrystalline, consisting of multiple grains. The arrangement and size of these grains, along with other structural features, define the microstructure of the material, which can be controlled by manipulating thermodynamics and kinetics during synthesis and processing.
Phase: A region of material with uniform composition and structure.
Microstructure: The spatial arrangement of grains and phases within a solid, observable at various length scales.
Polycrystalline: Material made up of many small crystals (grains).
Grain: A single crystal within a polycrystalline material.
Thermodynamics/Kinetics: Control which phases form and their microstructure.
Example: Microstructure of ceramics, metals, and polymers can be tailored for specific properties.
Microstructure Examples
Microstructure varies widely between ceramics, metals, and polymers, each offering unique advantages and limitations based on their synthesis and processing.
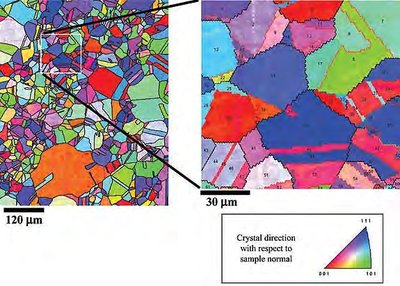
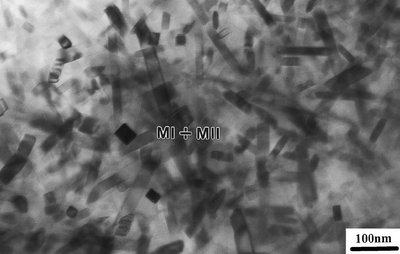
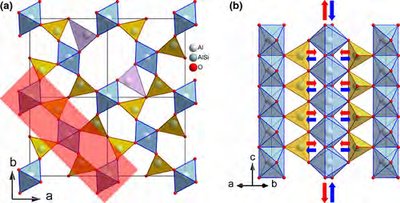
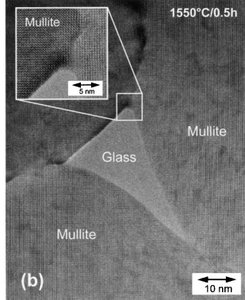
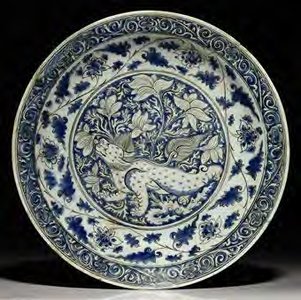
Ceramic Microstructure (Mullite): Ceramics often display complex grain structures and phase boundaries.
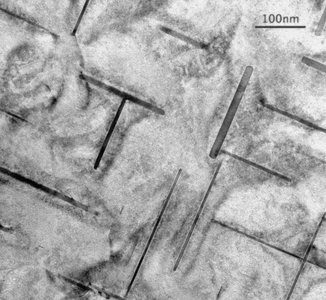
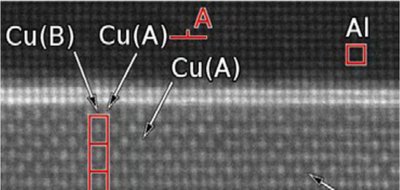
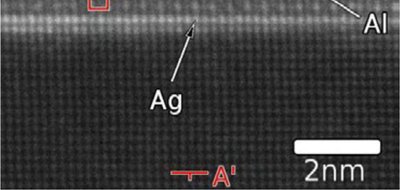
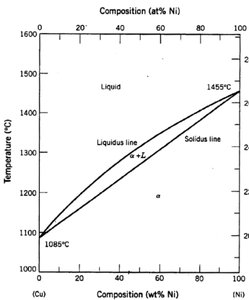
Metal Microstructure (Al-Cu Alloy): Metals can form intricate grain patterns, with properties influenced by alloying and heat treatment.
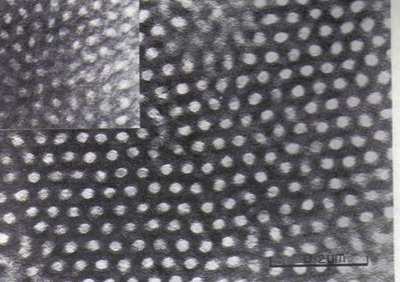
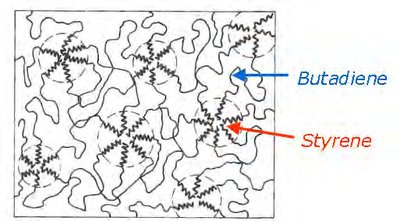
Polymer Microstructure (SBS Rubber): Polymers self-assemble during synthesis, encoding structure at the molecular level.

Phase Diagrams
Equilibrium Phase Diagrams
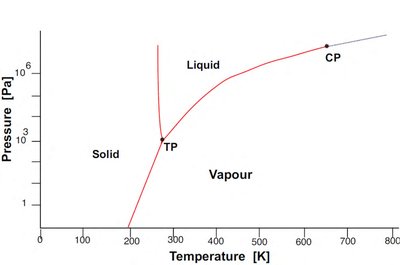
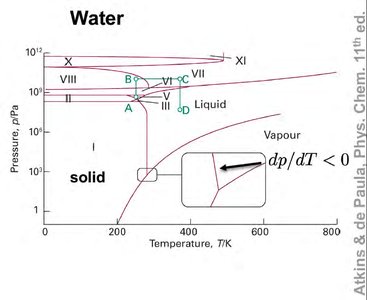
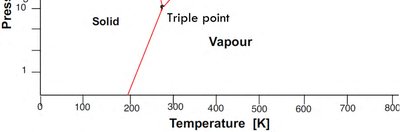
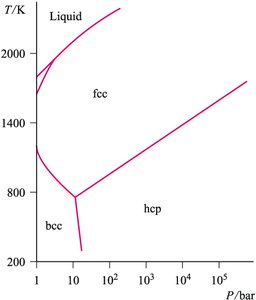
Phase diagrams are graphical representations showing which phases are thermodynamically stable at given conditions (e.g., pressure and temperature). Lines on the diagram indicate boundaries where phases coexist, and phase transitions occur when conditions cross these boundaries.
Critical Point: The end point of a phase equilibrium curve.
Triple Point: The unique set of conditions where three phases coexist.
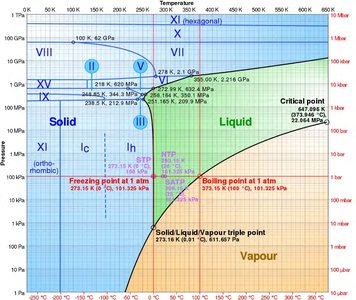
Example: Water has multiple solid polymorphs, each stable under different conditions.
Composition-Temperature Phase Diagrams
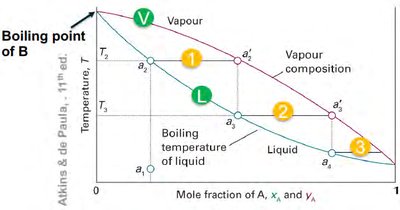
These diagrams show the predominance of equilibrium phases as a function of temperature and composition, often for binary mixtures at constant pressure. They are fundamental for understanding miscibility, melting, and solidification in both organic and inorganic systems.
Binary Phase Diagram: Shows phase behavior for two-component systems.
Miscible Mixtures: Both components mix in all proportions.
Immiscible Mixtures: Components do not mix, leading to eutectic or eutectoid behavior.
Eutectic Point: The lowest melting point for a mixture, where two solids and a liquid coexist.


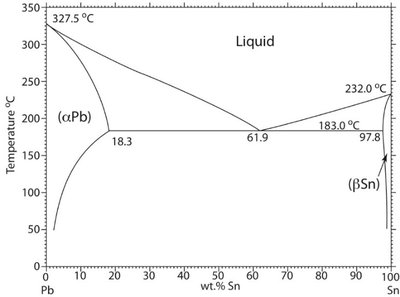
Eutectic Phase Diagrams: Lead-Tin System
The lead-tin system is a classic example of a eutectic phase diagram, relevant for solder applications. The eutectic point represents the lowest melting temperature, and the diagram shows solubility limits and phase boundaries.
Melting Point of Pure Lead: 327.5°C
Melting Point of Pure Tin: 232.0°C
Eutectic Solder Melting Point: 183.0°C (much lower than either pure metal)
Maximum Tin Solubility in Lead: 18.3 wt% Sn


Lever Rule and Phase Proportions
The lever rule is a quantitative method for determining the proportions of coexisting phases in a two-phase region of a phase diagram. It is widely used in both organic and inorganic systems.
Fraction of Phase α:
Fraction of Phase γ:
Application: Used to calculate equilibrium compositions and amounts in alloys, ceramics, and polymers.
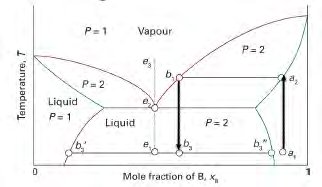
Complex Phase Diagrams and Intermediate Compounds
Intermediate Compounds and Stoichiometry
Some systems form intermediate compounds with specific stoichiometry and crystal structure. The phase diagram can be divided into sections, each with characteristic features, and interpreted separately.
Intermediate Compound (AxB): Forms at a specific composition, often with unique properties.
Phase Diagram Sections: Each section can be analyzed using the same principles as simpler diagrams.
Example: Ceramic and metal systems often display such behavior.
Composition Calculations: Atomic and Weight Fractions
Atomic and Weight Fraction Calculations
Composition can be expressed in terms of atomic fraction or weight fraction. These calculations are essential for understanding material properties and phase behavior.
Atomic Fraction:
Weight Fraction:
Atomic Mass (mx): Used to convert between atomic and weight fractions.
Example: NdFeB magnets and Fe3C in steel.
Summary Table: Phase Diagram Features
Feature | Description | Example |
|---|---|---|
Phase | Region with uniform composition/structure | Solid, liquid, vapor |
Microstructure | Arrangement of grains/phases | Ceramic, metal, polymer |
Critical Point | End of phase equilibrium curve | Water, iron |
Triple Point | Three phases coexist | Water |
Eutectic Point | Lowest melting point in mixture | Lead-tin solder |
Lever Rule | Phase proportion calculation | Alloys, ceramics |
Intermediate Compound | Specific stoichiometry | AxB in ceramics/metals |
Additional info: These notes expand on the original content by providing definitions, formulas, and examples relevant to phase diagrams and microstructure, which are foundational for understanding organic and inorganic materials in chemistry.
