 Back
BackSpectral Analysis in Organic Chemistry: IR and NMR Interpretation Guide
Study Guide - Smart Notes
 Tailored notes based on your materials, expanded with key definitions, examples, and context.
Introduction to Spectral Analysis in Organic Chemistry
Spectral analysis is a fundamental tool in organic chemistry for determining the structure of organic compounds. The two most commonly used spectroscopic techniques are Infrared (IR) Spectroscopy and Nuclear Magnetic Resonance (NMR) Spectroscopy. This guide provides a structured approach to interpreting IR and NMR spectra, with emphasis on identifying functional groups, calculating the index of hydrogen deficiency, and deducing molecular structure.
Infrared (IR) Spectroscopy
Principles of IR Spectroscopy
IR spectroscopy measures the absorption of infrared light by a molecule, which causes vibrations in chemical bonds. The resulting spectrum is a plot of % transmittance (or absorbance) versus wavenumber (cm-1), and is characteristic of the molecular structure.
Wavenumber: Indicates the energy of the vibration; higher wavenumbers correspond to stronger bonds or lighter atoms.
Intensity: Reflects the change in dipole moment during vibration; more polar bonds give stronger signals.
Shape: The appearance of the peak (broad, sharp, etc.) can help identify the functional group.
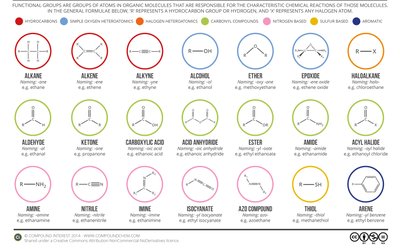
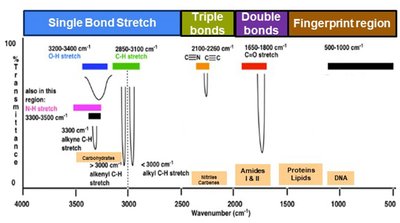
Key IR Absorption Regions and Functional Group Identification
O–H stretch: 3200–3600 cm-1 (broad, strong; alcohols and acids)
N–H stretch: 3300–3500 cm-1 (medium, may be broad or sharp; amines, amides)
C–H stretch: 2850–3100 cm-1 (sharp; alkanes, alkenes, aromatics)
C≡C, C≡N stretch: 2100–2260 cm-1 (sharp; alkynes, nitriles)
C=O stretch: 1650–1750 cm-1 (strong, sharp; ketones, aldehydes, acids, esters)
C=C stretch: 1600–1680 cm-1 (medium; alkenes, aromatics)
Fingerprint region: 600–1400 cm-1 (complex, unique to each molecule)
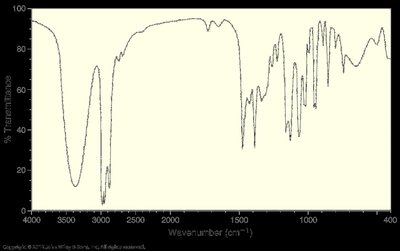
Analyzing an IR Spectrum: Stepwise Approach
Check if the molecular formula is provided. If yes, calculate the Index of Hydrogen Deficiency (IHD).
Focus on signals above 1500 cm-1 for functional group identification.
Analyze wavenumber, intensity, and shape for each signal.
Inspect the 2700–4000 cm-1 region for bonds to hydrogen (O–H, N–H, C–H).
Absence of certain bands can be diagnostic (e.g., no C=O means no carbonyl group).
Remember, only bonds with a dipole moment change are IR active.
Examples of IR Interpretation
Broad U-shaped peak at 3300 cm-1: O–H stretch (alcohols, acids)
V-shaped peak at 3300–3400 cm-1: N–H stretch (secondary amines)
Sharp spike at 3000 cm-1: sp3 C–H stretch
Strong peak at 1725 cm-1: C=O stretch (aldehyde or ketone)
Nuclear Magnetic Resonance (NMR) Spectroscopy
Principles of 1H NMR Spectroscopy
NMR spectroscopy provides information about the hydrogen atoms in a molecule. The spectrum displays chemical shifts (δ, in ppm), integration (relative number of protons), and splitting patterns (multiplicity) that reveal the molecular environment of each proton.
Chemical shift (δ): Indicates the electronic environment; deshielded protons appear downfield (higher δ).
Integration: Area under each peak is proportional to the number of protons.
Multiplicity (splitting): Number of neighboring protons (n+1 rule).
Stepwise NMR Structure Elucidation
Determine the number of different types of protons (number of signals).
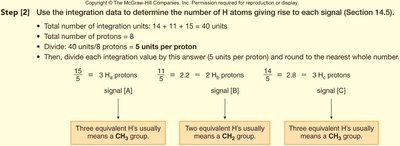
Use integration to find the relative number of protons for each signal.
Analyze splitting patterns to deduce neighboring protons.
Assign chemical shifts to likely environments (e.g., alkyl, alkoxy, aromatic).
Piece together the structure, rationalizing all spectral data.
Example: Structure Determination from IR and NMR
Molecular formula: C3H8O
IHD: 0 (saturated compound)
IR: Broad, intense signal at 3300 cm-1 (O–H group, alcohol)
NMR:
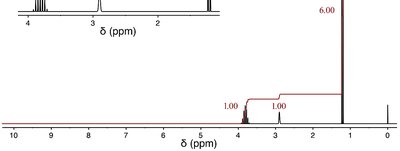
1.1 ppm (doublet, 6H): Two equivalent methyl groups
2.9 ppm (broad singlet, 1H): Hydroxyl proton (OH)
3.7 ppm (septet, 1H): Methine proton adjacent to two methyl groups and an OH
Structure: (CH3)2CHOH (2-propanol)
Index of Hydrogen Deficiency (IHD)
Definition and Calculation
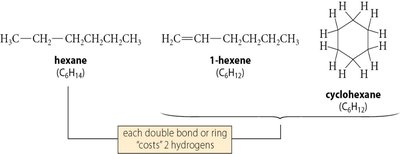
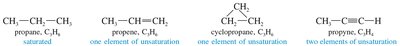
The Index of Hydrogen Deficiency (IHD), also called degree of unsaturation, indicates the number of rings and/or π bonds in a molecule. Each ring or π bond reduces the number of hydrogens by two compared to a saturated hydrocarbon (CnH2n+2).
Formula: where C = number of carbons, N = number of nitrogens, H = number of hydrogens, X = number of halogens.
Oxygen atoms: Ignore in IHD calculation.
Halogens: Count as hydrogens.
Nitrogen: Add one hydrogen for each nitrogen.
Examples
C5H8: (two degrees of unsaturation)
C4H7Br: Count Br as H:
C6H7N: Add N as H:
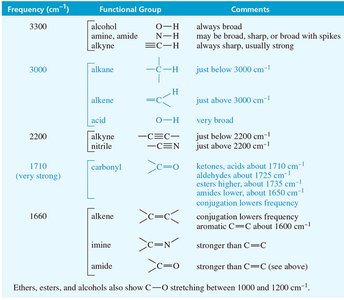
Summary Table: Key IR Absorptions
Frequency (cm-1) | Functional Group | Comments |
|---|---|---|
3300 | O–H (alcohol), N–H (amine, amide), ≡C–H (alkyne) | O–H always broad; N–H may be broad or sharp; ≡C–H always sharp |
3000 | C–H (alkane, alkene, acid) | Just below or above 3000 cm-1 |
2200 | C≡C (alkyne), C≡N (nitrile) | Just above 2200 cm-1 |
1710 | C=O (carbonyl) | Keto, acid, ester, amide, anhydride; conjugation lowers frequency |
1660 | C=C (alkene), C=N (imine) | Conjugation lowers frequency |
Problem-Solving Strategy for Spectral Analysis
Determine the molecular formula and calculate IHD.
Identify functional groups using IR spectroscopy.
Analyze the NMR spectrum for number, type, and environment of protons.
Integrate all spectral data to propose a consistent structure.
Additional info:
Conjugation, hydrogen bonding, and ring strain can shift IR absorption frequencies.
Overtones and impurities may cause weak or unexpected IR signals.
In NMR, electronegative atoms (O, N, halogens) deshield protons, shifting their signals downfield (higher δ).
