 Back
BackChapter 1: Representing Motion – Foundations of Kinematics
Study Guide - Smart Notes
 Tailored notes based on your materials, expanded with key definitions, examples, and context.
Chapter 1: Representing Motion
1.1 Motion: A First Look
Motion is the change in position or orientation of an object with respect to time and its reference point. Understanding motion is fundamental to physics, as it allows us to describe and predict the behavior of objects in the universe.
Types of Motion:
Straight-line (linear) motion: Movement along a straight path.
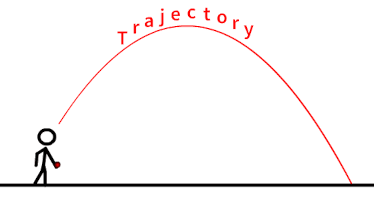
Projectile motion: Curved path under the influence of gravity.
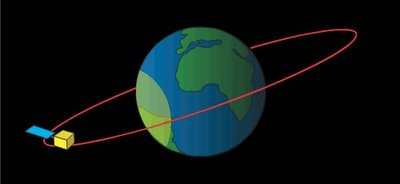
Circular motion: Movement along a circular path.
Rotational motion: Object rotates about an axis.
Trajectory: The path along which an object moves.


1.2 Models and Modeling
Physicists use models to simplify and analyze real-world phenomena. The particle model represents an object as a single point (dot) to focus on its position and motion, ignoring its size and shape. Motion diagrams are composite images showing an object's position at several equally spaced instants of time, helping visualize changes in motion.
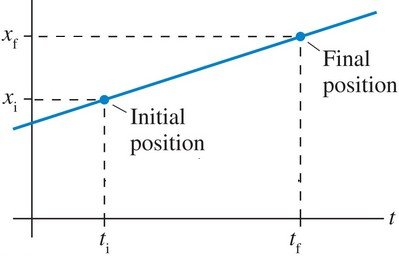
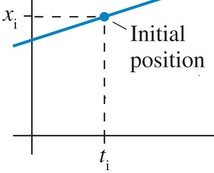
1.3 Position and Time: Putting Numbers on Nature
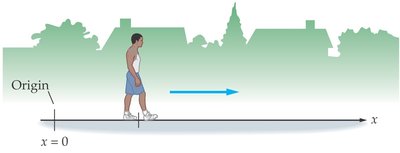
To describe motion quantitatively, we assign numbers to position and time using a coordinate system. The origin is the reference point, and the positive direction is defined along the axis (usually x or y).
Displacement (\( \Delta x \)): The change in position, calculated as \( \Delta x = x_f - x_i \).
Time Interval (\( \Delta t \)): The change in time, calculated as \( \Delta t = t_f - t_i \).
Vector vs. Scalar: Displacement is a vector (magnitude and direction), while distance is a scalar (magnitude only).

Example: Calculating Displacement
Maria is at position \( x = 23\,\text{m} \). She undergoes a displacement \( \Delta x = -50\,\text{m} \). Her final position is:
1.4 Velocity
Average velocity is the rate of change of position with respect to time. It is a vector quantity, indicating both magnitude and direction.
Formula:
Velocity vs. Speed: Velocity uses displacement (vector), speed uses distance (scalar).
Example: Calculating Average Velocity
\( \Delta x = +7\,\text{m} \), \( \Delta t = 2\,\text{s} \)
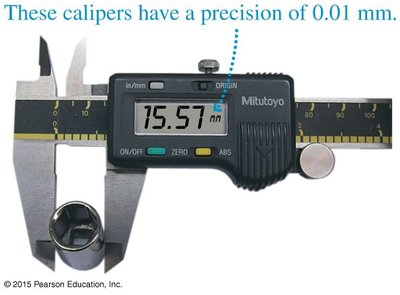
1.5 A Sense of Scale: Significant Figures, Scientific Notation, and Units
Physics relies on precise measurements and standardized units. Understanding significant figures, scientific notation, and unit conversions is essential for accurate calculations.
Significant Figures: Digits in a measurement that are reliably known, reflecting the precision of the instrument.
Scientific Notation: Expresses numbers as a product of a coefficient and a power of ten (e.g., \( 2.34 \times 10^{-6} \)).
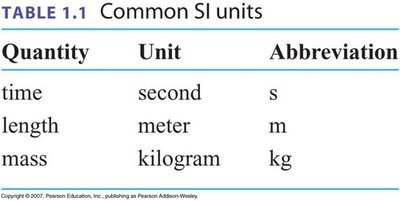
SI Units: The International System of Units standardizes measurements for time (second, s), length (meter, m), and mass (kilogram, kg).
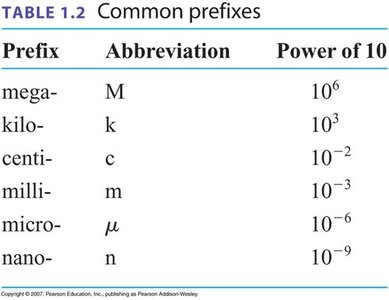
Prefixes: Used to express powers of ten (e.g., kilo-, centi-, milli-).
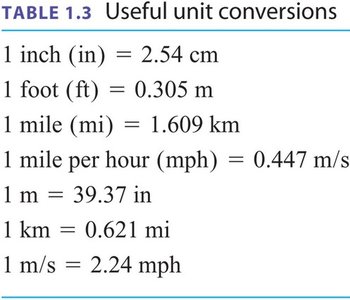
Unit Conversion: Multiplying by conversion factors to change units without altering the value.
Example: Unit Conversion
Convert 65.0 mph to m/s:
Chapter 2: Motion in One Dimension
2.1 Describing Motion
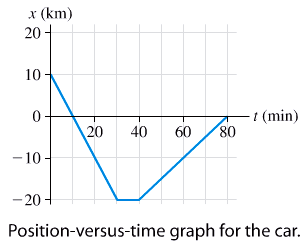
Motion in one dimension can be described using position, time, displacement, velocity, and graphical analysis. Position vs. time graphs and motion diagrams are essential tools for visualizing and interpreting motion.
Position vs. Time Graph: The slope of the graph represents velocity. A positive slope indicates motion in the positive direction, a negative slope indicates motion in the negative direction, and a zero slope indicates the object is at rest.
Motion Diagram: Shows the object's position at equal time intervals, with arrows indicating direction and relative speed.
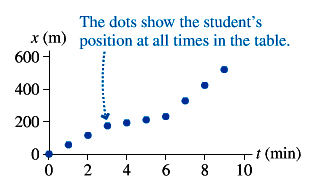
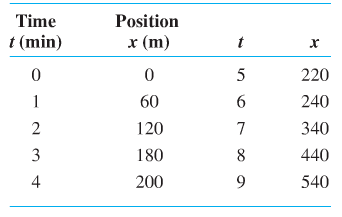
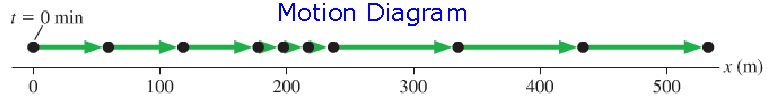
Table: Measured Position of a Student Walking to School
Time t (min) | Position x (m) | t | x |
|---|---|---|---|
0 | 0 | 5 | 220 |
1 | 60 | 6 | 240 |
2 | 120 | 7 | 340 |
3 | 180 | 8 | 440 |
4 | 200 | 9 | 540 |
Key Equations
Displacement:
Time Interval:
Average Velocity:
Interpreting Position vs. Time Graphs
Positive slope: Moving in the positive direction.
Negative slope: Moving in the negative direction.
Zero slope: Object is at rest.
Appendix: Tables and Reference Data
Table: Common SI Units
Quantity | Unit | Abbreviation |
|---|---|---|
time | second | s |
length | meter | m |
mass | kilogram | kg |
Table: Common Prefixes
Prefix | Abbreviation | Power of 10 |
|---|---|---|
mega- | M | 10^6 |
kilo- | k | 10^3 |
centi- | c | 10^{-2} |
milli- | m | 10^{-3} |
micro- | \mu | 10^{-6} |
nano- | n | 10^{-9} |
Table: Useful Unit Conversions
1 inch (in) | = 2.54 cm |
1 foot (ft) | = 0.305 m |
1 mile (mi) | = 1.609 km |
1 mile per hour (mph) | = 0.447 m/s |
1 m | = 39.37 in |
1 km | = 0.621 mi |
1 m/s | = 2.24 mph |
Additional info: This guide covers the foundational concepts of kinematics, including types of motion, modeling, displacement, velocity, significant figures, scientific notation, SI units, and unit conversions. These concepts are essential for further study in physics and engineering.
