 Back
BackKinematics, Acceleration, and Motion Graphs – Step-by-Step Physics Guidance
Study Guide - Smart Notes
 Tailored notes based on your materials, expanded with key definitions, examples, and context.
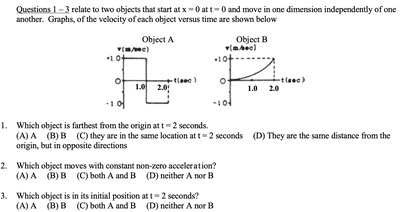
Q1. Which object is farthest from the origin at t = 2 seconds?
Background
Topic: Kinematics and displacement from velocity-time graphs
This question tests your ability to interpret velocity-time graphs and relate them to displacement, which is the area under the curve.
Key Terms and Formulas:
Displacement: The area under the velocity-time graph.
Velocity (): Rate of change of position.
Time (): Duration over which motion occurs.
Area under curve:
Step-by-Step Guidance
Examine the velocity-time graphs for both objects. Note the direction (positive or negative velocity) and the time intervals.
Calculate the area under each curve for the interval seconds. For Object A, split the area into two regions: (positive velocity) and (negative velocity).
For Object B, observe the constant positive velocity throughout the interval.
Compare the net displacement for each object by summing the areas (taking care with signs).
Try solving on your own before revealing the answer!
Final Answer: B
Object B is farthest from the origin at seconds because its displacement is positive and larger than Object A's net displacement, which cancels out.
Q2. Which object moves with constant non-zero acceleration?
Background
Topic: Acceleration from velocity-time graphs
This question tests your ability to recognize constant acceleration from the shape of a velocity-time graph.
Key Terms and Formulas:
Acceleration (): Rate of change of velocity.
Constant acceleration: Linear (straight line) velocity-time graph with non-zero slope.
Step-by-Step Guidance
Look for a velocity-time graph that is a straight line with a non-zero slope (not horizontal).
Object A has a step function (not a straight line), so its acceleration is not constant.
Object B's graph is a straight line with a positive slope, indicating constant non-zero acceleration.
Try solving on your own before revealing the answer!
Final Answer: D
Object B moves with constant non-zero acceleration, as shown by its straight, sloped velocity-time graph.
Q3. Which object is in its initial position at t = 2 seconds?
Background
Topic: Displacement and position from velocity-time graphs
This question tests your understanding of how displacement relates to the area under the velocity-time graph.
Key Terms and Formulas:
Initial position: The starting point ().
Displacement: Area under the velocity-time graph.
If net area is zero, object returns to initial position.
Step-by-Step Guidance
Calculate the area under the velocity-time graph for each object from to seconds.
For Object A, check if the positive area from $0 second is canceled by the negative area from $1 seconds.
For Object B, the area is always positive, so it does not return to its initial position.
Try solving on your own before revealing the answer!
Final Answer: A
Object A is in its initial position at seconds because the net area under its velocity-time graph is zero.
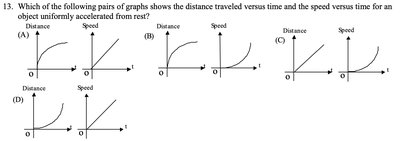
Q13. Which of the following pairs of graphs shows the distance traveled versus time and the speed versus time for an object uniformly accelerated from rest?
Background
Topic: Kinematics of uniformly accelerated motion
This question tests your ability to recognize the shapes of distance-time and speed-time graphs for an object starting from rest and accelerating uniformly.
Key Terms and Formulas:
Uniform acceleration: Acceleration is constant.
Distance vs. time: (parabolic curve)
Speed vs. time: (straight line)
Step-by-Step Guidance
Recall that for uniform acceleration from rest, distance increases quadratically with time, and speed increases linearly.
Examine each graph pair and identify which shows a parabolic distance-time curve and a straight-line speed-time curve.
Compare the options to see which matches the expected shapes.
Try solving on your own before revealing the answer!
Final Answer: B
Option B shows a parabolic distance-time graph and a straight-line speed-time graph, which is correct for uniform acceleration from rest.
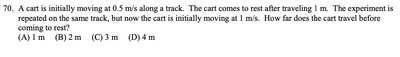
Q70. A cart is initially moving at 0.5 m/s along a track. The cart comes to rest after traveling 1 m. The experiment is repeated on the same track, but now the cart is initially moving at 1 m/s. How far does the cart travel before coming to rest?
Background
Topic: Kinematics and energy conservation
This question tests your understanding of how stopping distance relates to initial speed, assuming constant deceleration.
Key Terms and Formulas:
Initial velocity (): Starting speed of the cart.
Stopping distance (): Distance traveled before coming to rest.
Constant acceleration:
For stopping:
Step-by-Step Guidance
Use the kinematic equation and set for stopping.
For the first trial, plug in m/s and m to solve for .
For the second trial, use m/s and the same to solve for the new stopping distance.
Try solving on your own before revealing the answer!
Final Answer: D (4 m)
The stopping distance is proportional to the square of the initial speed, so doubling the speed quadruples the distance.
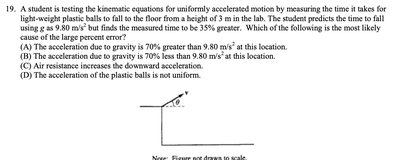
Q19. A student is testing the kinematic equations for uniformly accelerated motion by measuring the time it takes for light-weight plastic balls to fall to the floor from a height of 3 m in the lab. The student predicts the time to fall using a g = 9.80 m/s^2 but finds the measured time to be 35% greater. Which of the following is the most likely cause of the large percent error?
Background
Topic: Free fall, air resistance, and experimental error
This question tests your understanding of how air resistance affects the motion of objects and the accuracy of kinematic predictions.
Key Terms and Formulas:
Free fall: Motion under gravity alone.
Air resistance: Opposes motion, increases time to fall.
Kinematic equation:
Step-by-Step Guidance
Compare predicted and measured times. If measured time is greater, something is slowing the fall.
Consider the effect of air resistance on light-weight objects.
Evaluate the answer choices for the most plausible explanation.
Try solving on your own before revealing the answer!
Final Answer: C
Air resistance increases the downward acceleration, causing the ball to fall slower than predicted by the kinematic equations.
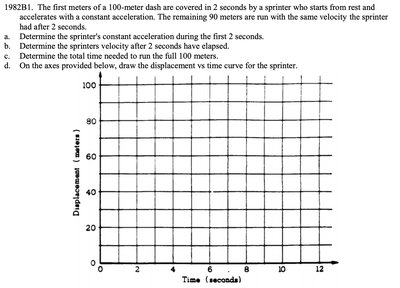
Q1982B1. The first meters of a 100-meter dash are covered in 2 seconds by a sprinter who starts from rest and accelerates with a constant acceleration. The remaining 90 meters are run with the same velocity the sprinter had after 2 seconds.
Background
Topic: Kinematics, constant acceleration, and uniform motion
This question tests your ability to apply kinematic equations to solve for acceleration, velocity, and time, and to interpret displacement-time graphs.
Key Terms and Formulas:
Constant acceleration:
Velocity after acceleration:
Uniform motion:
Step-by-Step Guidance
For the first 10 meters in 2 seconds, use to solve for .
Calculate the velocity after 2 seconds using .
For the remaining 90 meters, use to solve for the time needed.
Add the times for both segments to find the total time for the dash.
Draw the displacement vs. time curve, showing the initial acceleration and then constant velocity.
Try solving on your own before revealing the answer!
Final Answer: See solution image
Acceleration: , velocity after 2 s: , total time: , and the displacement-time graph is a curve followed by a straight line.
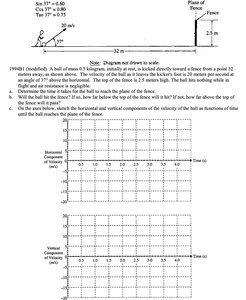
Q1994B1 (modified). A ball of mass 0.3 kg is kicked directly toward a fence from a point 32 meters away, as shown. The velocity of the ball as it leaves the kicker's foot is 20 meters per second at an angle of 37° above the horizontal. The top of the fence is 2.5 meters high. The ball hits nothing while in flight.
Background
Topic: Projectile motion and kinematics
This question tests your ability to analyze projectile motion, including horizontal and vertical components, and to interpret velocity-time graphs.
Key Terms and Formulas:
Projectile motion: Two-dimensional motion under gravity.
Horizontal velocity:
Vertical velocity:
Time to reach fence:
Vertical position:
Step-by-Step Guidance
Resolve the initial velocity into horizontal and vertical components using trigonometric functions.
Calculate the time it takes for the ball to reach the fence using the horizontal component.
Determine the vertical position of the ball at that time to see if it clears the fence.
Draw the horizontal and vertical velocity vs. time graphs based on the equations above.
Try solving on your own before revealing the answer!
Final Answer: See solution image
The ball clears the fence, and the velocity-time graphs show constant horizontal velocity and decreasing vertical velocity due to gravity.
